


fig3
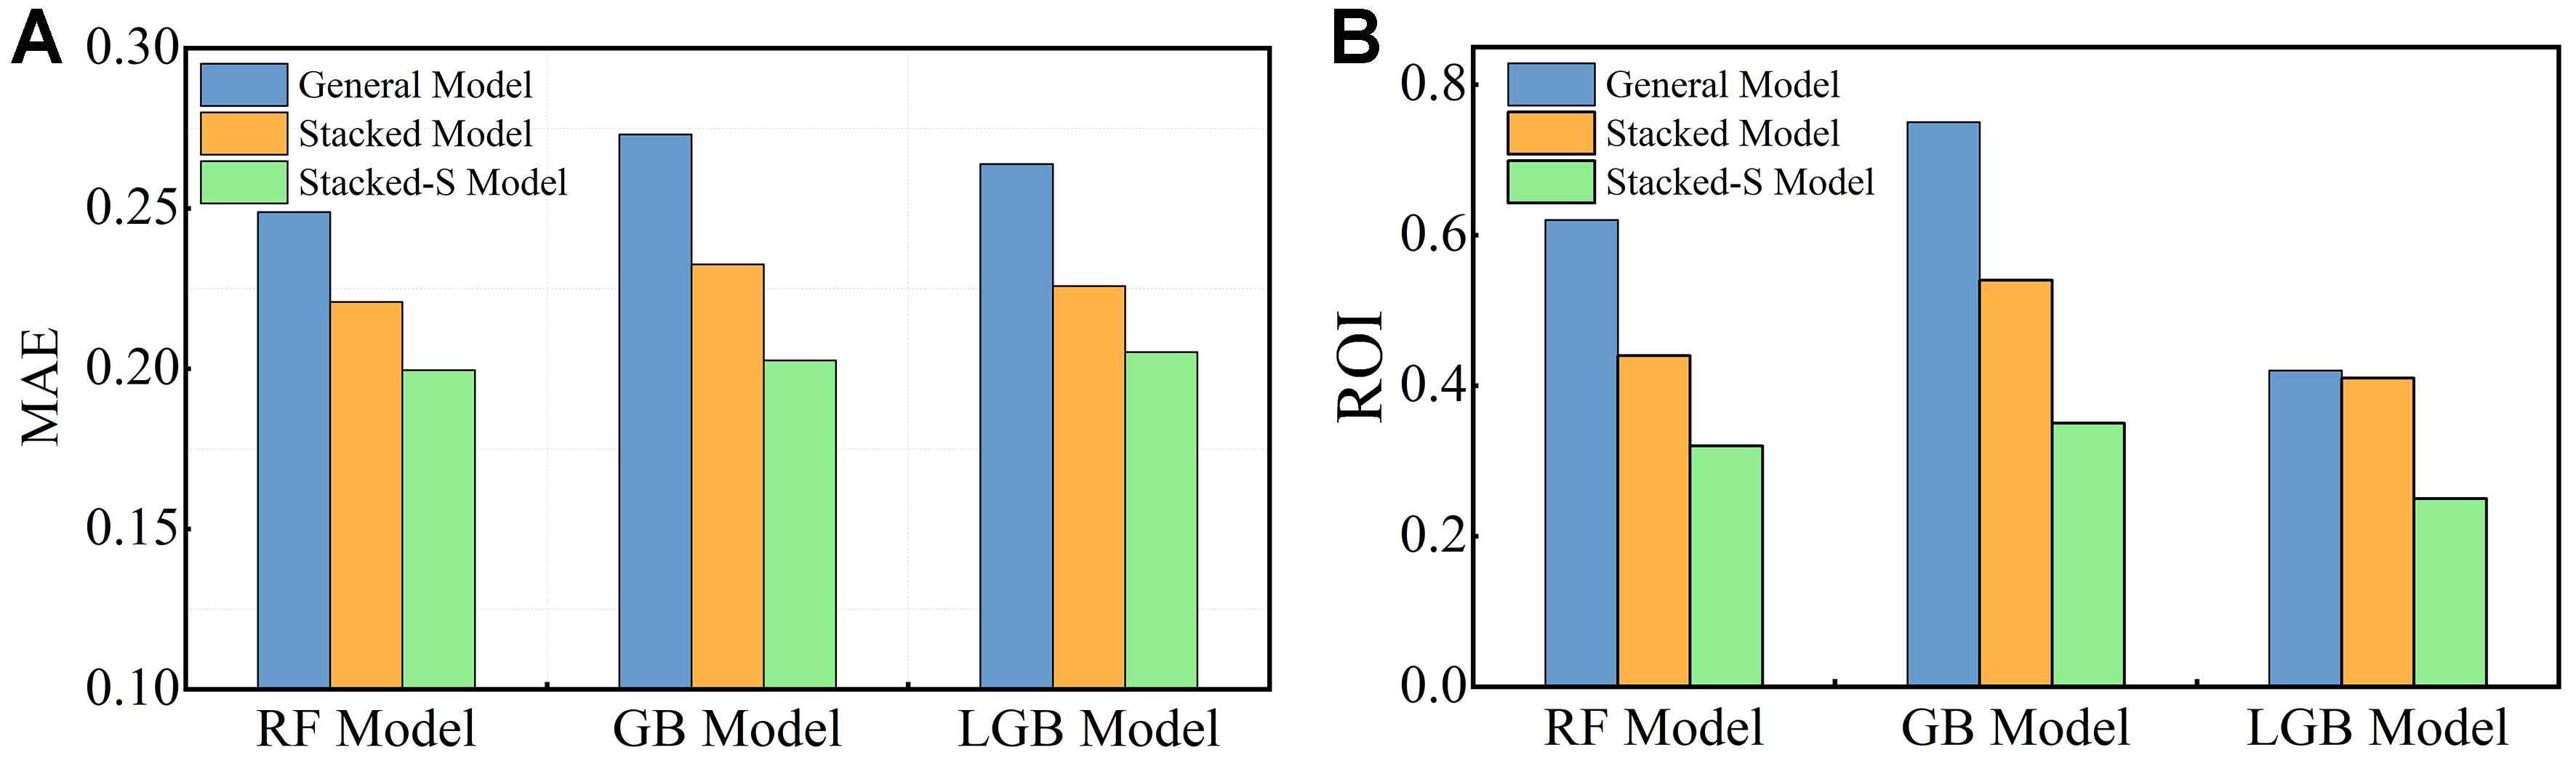
Figure 3. Performance comparison of different ML models. (A) MAE bar chart for three model types: RF, GBDT, and LGB; (B) ROI bar chart for three model types: RF, GBDT, and LGB. ML: Machine learning; MAE: mean absolute error; RF: random forest; GBDT: gradient boosting decision tree; LGB: lightGBM; ROI: relative overfitting index.


