


fig2
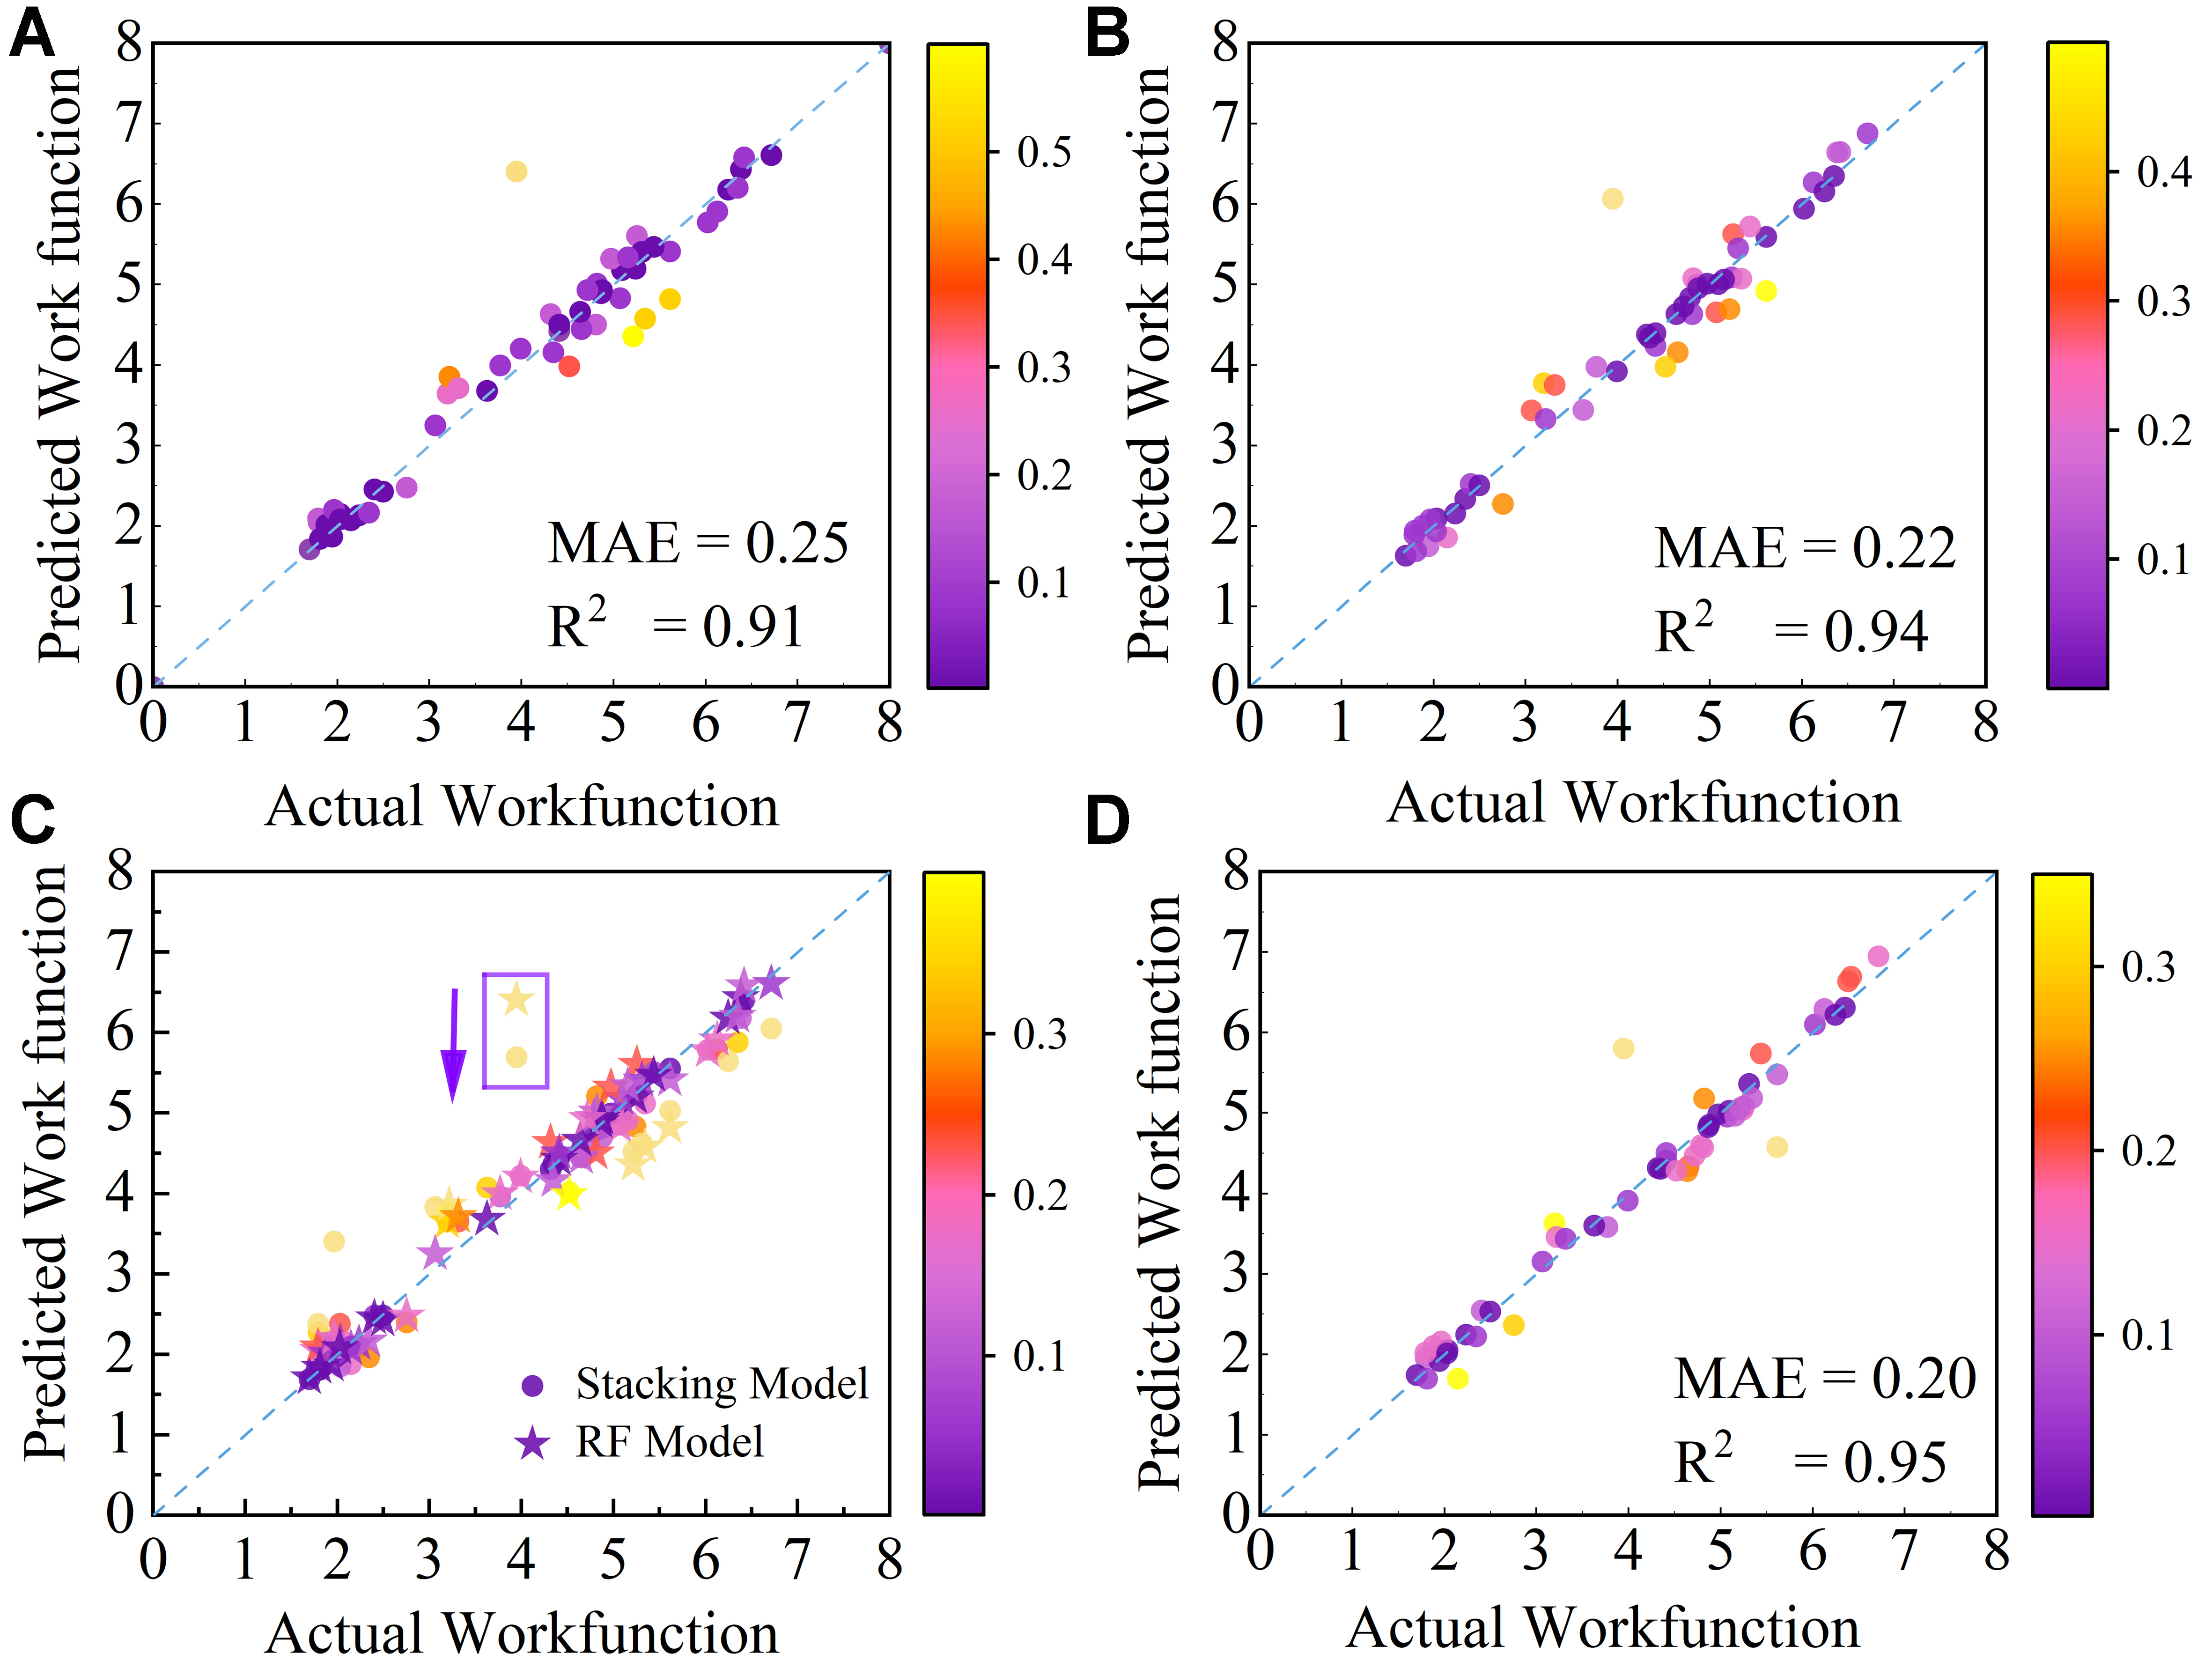
Figure 2. Scatter plots comparing predicted and actual work function values. (A) General RF model; (B) Stacked model with RF as the meta-model; (C) Stacked model with RF as the meta-model and General RF model; and (D) Stacked model with RF as the meta-model and incorporating SISSO descriptors. The color bar represents the deviation z between calculated and predicted values. RF: Random forest; SISSO: Sure Independence Screening and Sparsifying Operator.


