


fig6
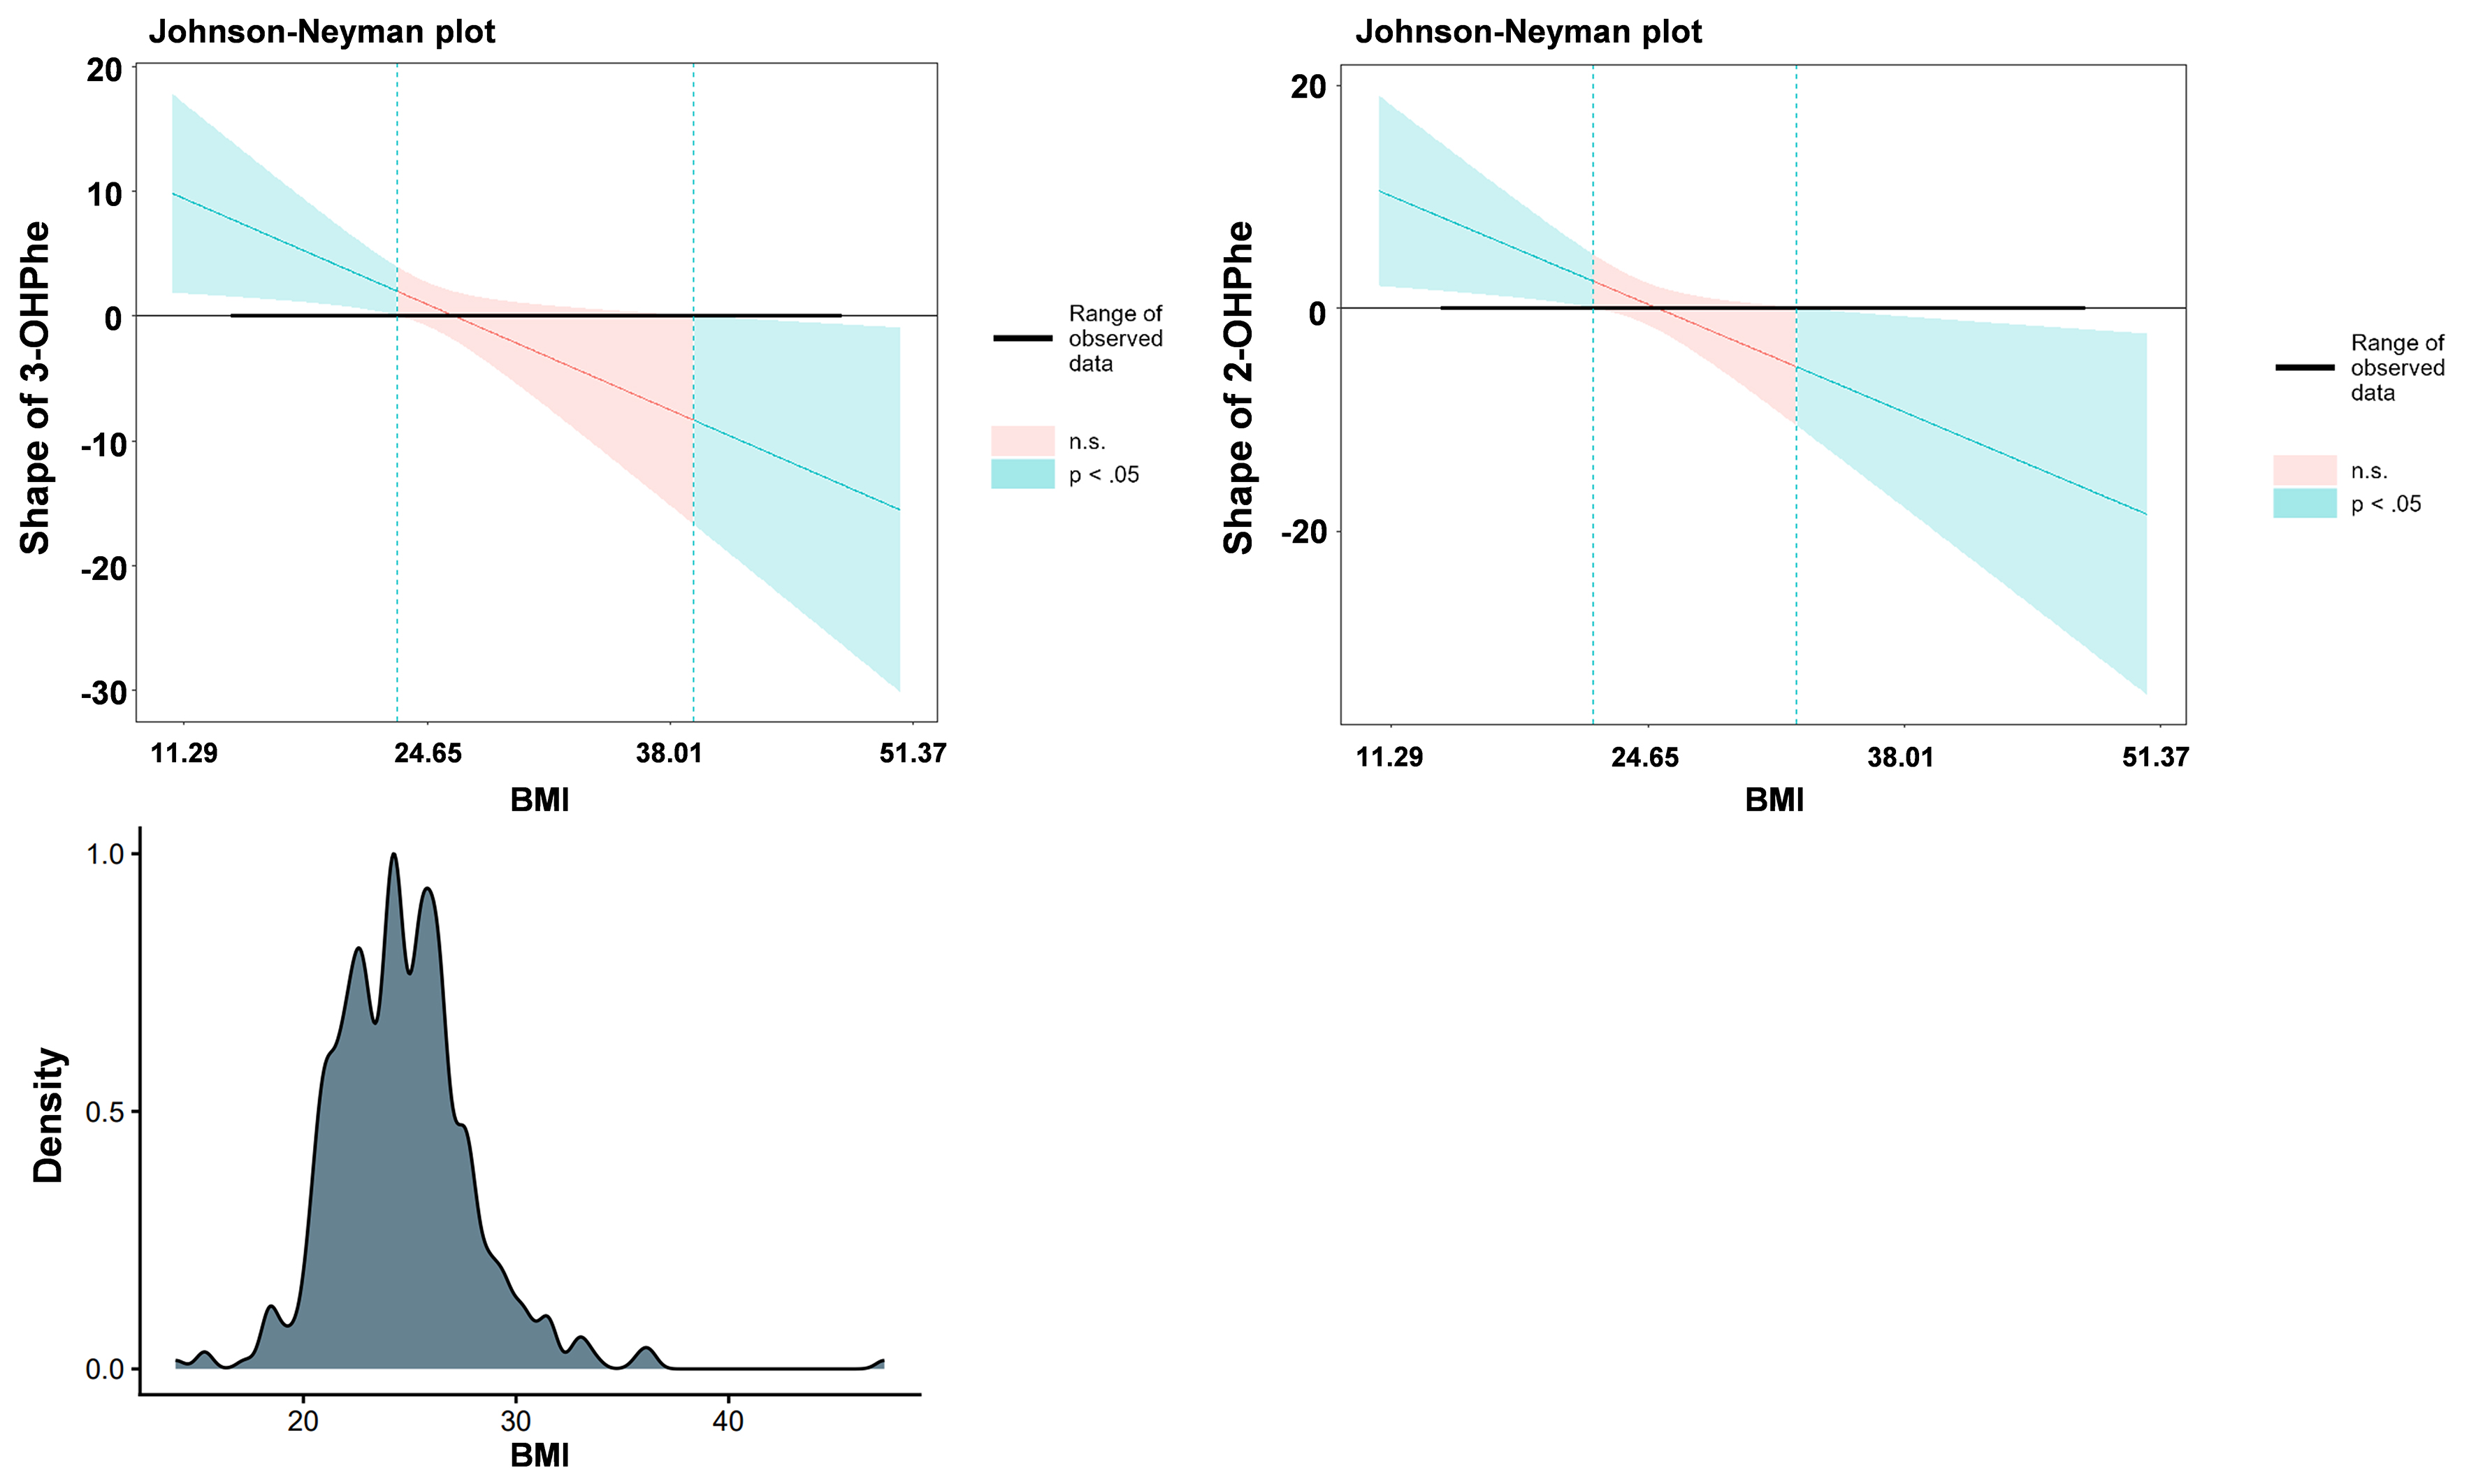
Figure 6. BMI moderates the relationship between urinary OH-PAHs and HAMA scores. Models were adjusted for age, sex, marital status, educational level, BMI, exercise, smoking status, and drinking. The lower panel displays a density plot illustrating the distribution of observed BMI values among study participants. BMI: Body-mass index; OH-PAHs: hydroxylated polycyclic aromatic hydrocarbons; HAMA: Hamilton Anxiety Scale; 3-OHPhe: 3-hydroxyphenanthrene; 2-OHPhe: 2-hydroxyphenanthrene.