


fig4
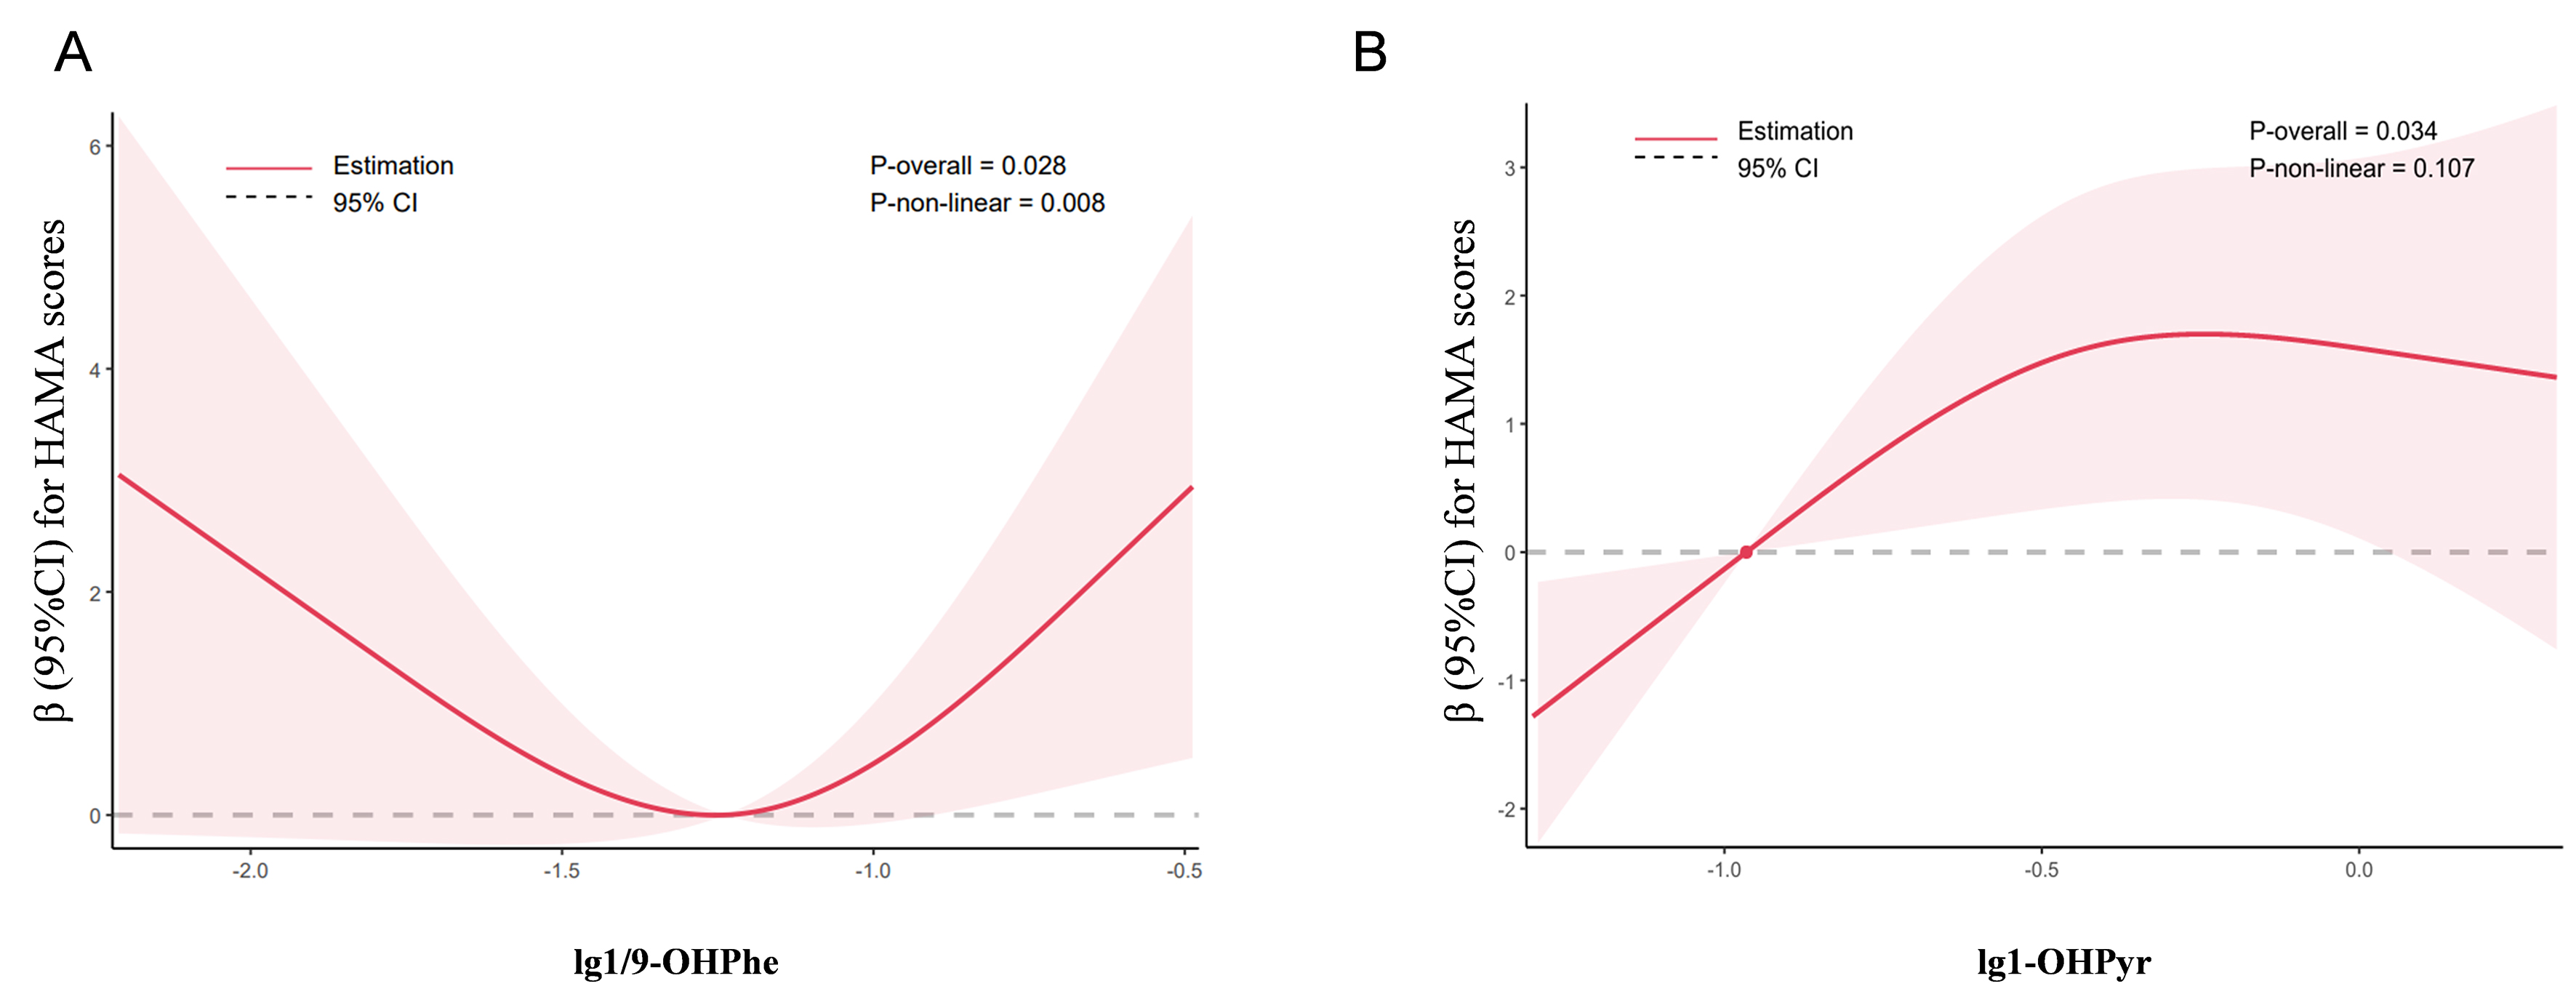
Figure 4. RCS analysis of the associations between urinary OH-PAHs and HAMA scores. (A) Dose-response relationship between 1/9-OHPhe and HAMA scores in the non-overweight subgroup after BMI stratification; models were adjusted for age, sex, marital status, educational level, exercise, smoking status, and drinking; (B) Dose-response relationship between 1-OHPyr and HAMA scores in the overall population; models were adjusted for age, sex, marital status, educational level, BMI, exercise, smoking status, and drinking. Shaded areas indicate 95%CIs for the fitted dose-response curves. RCS: Restricted cubic spline; OH-PAHs: hydroxylated polycyclic aromatic hydrocarbons; HAMA: Hamilton Anxiety Scale; 1/9-OHPhe: 1/9-hydroxyphenanthrene; BMI: body-mass index; 1-OHPyr: 1-hydroxypyrene; CIs: confidence intervals.