



fig3
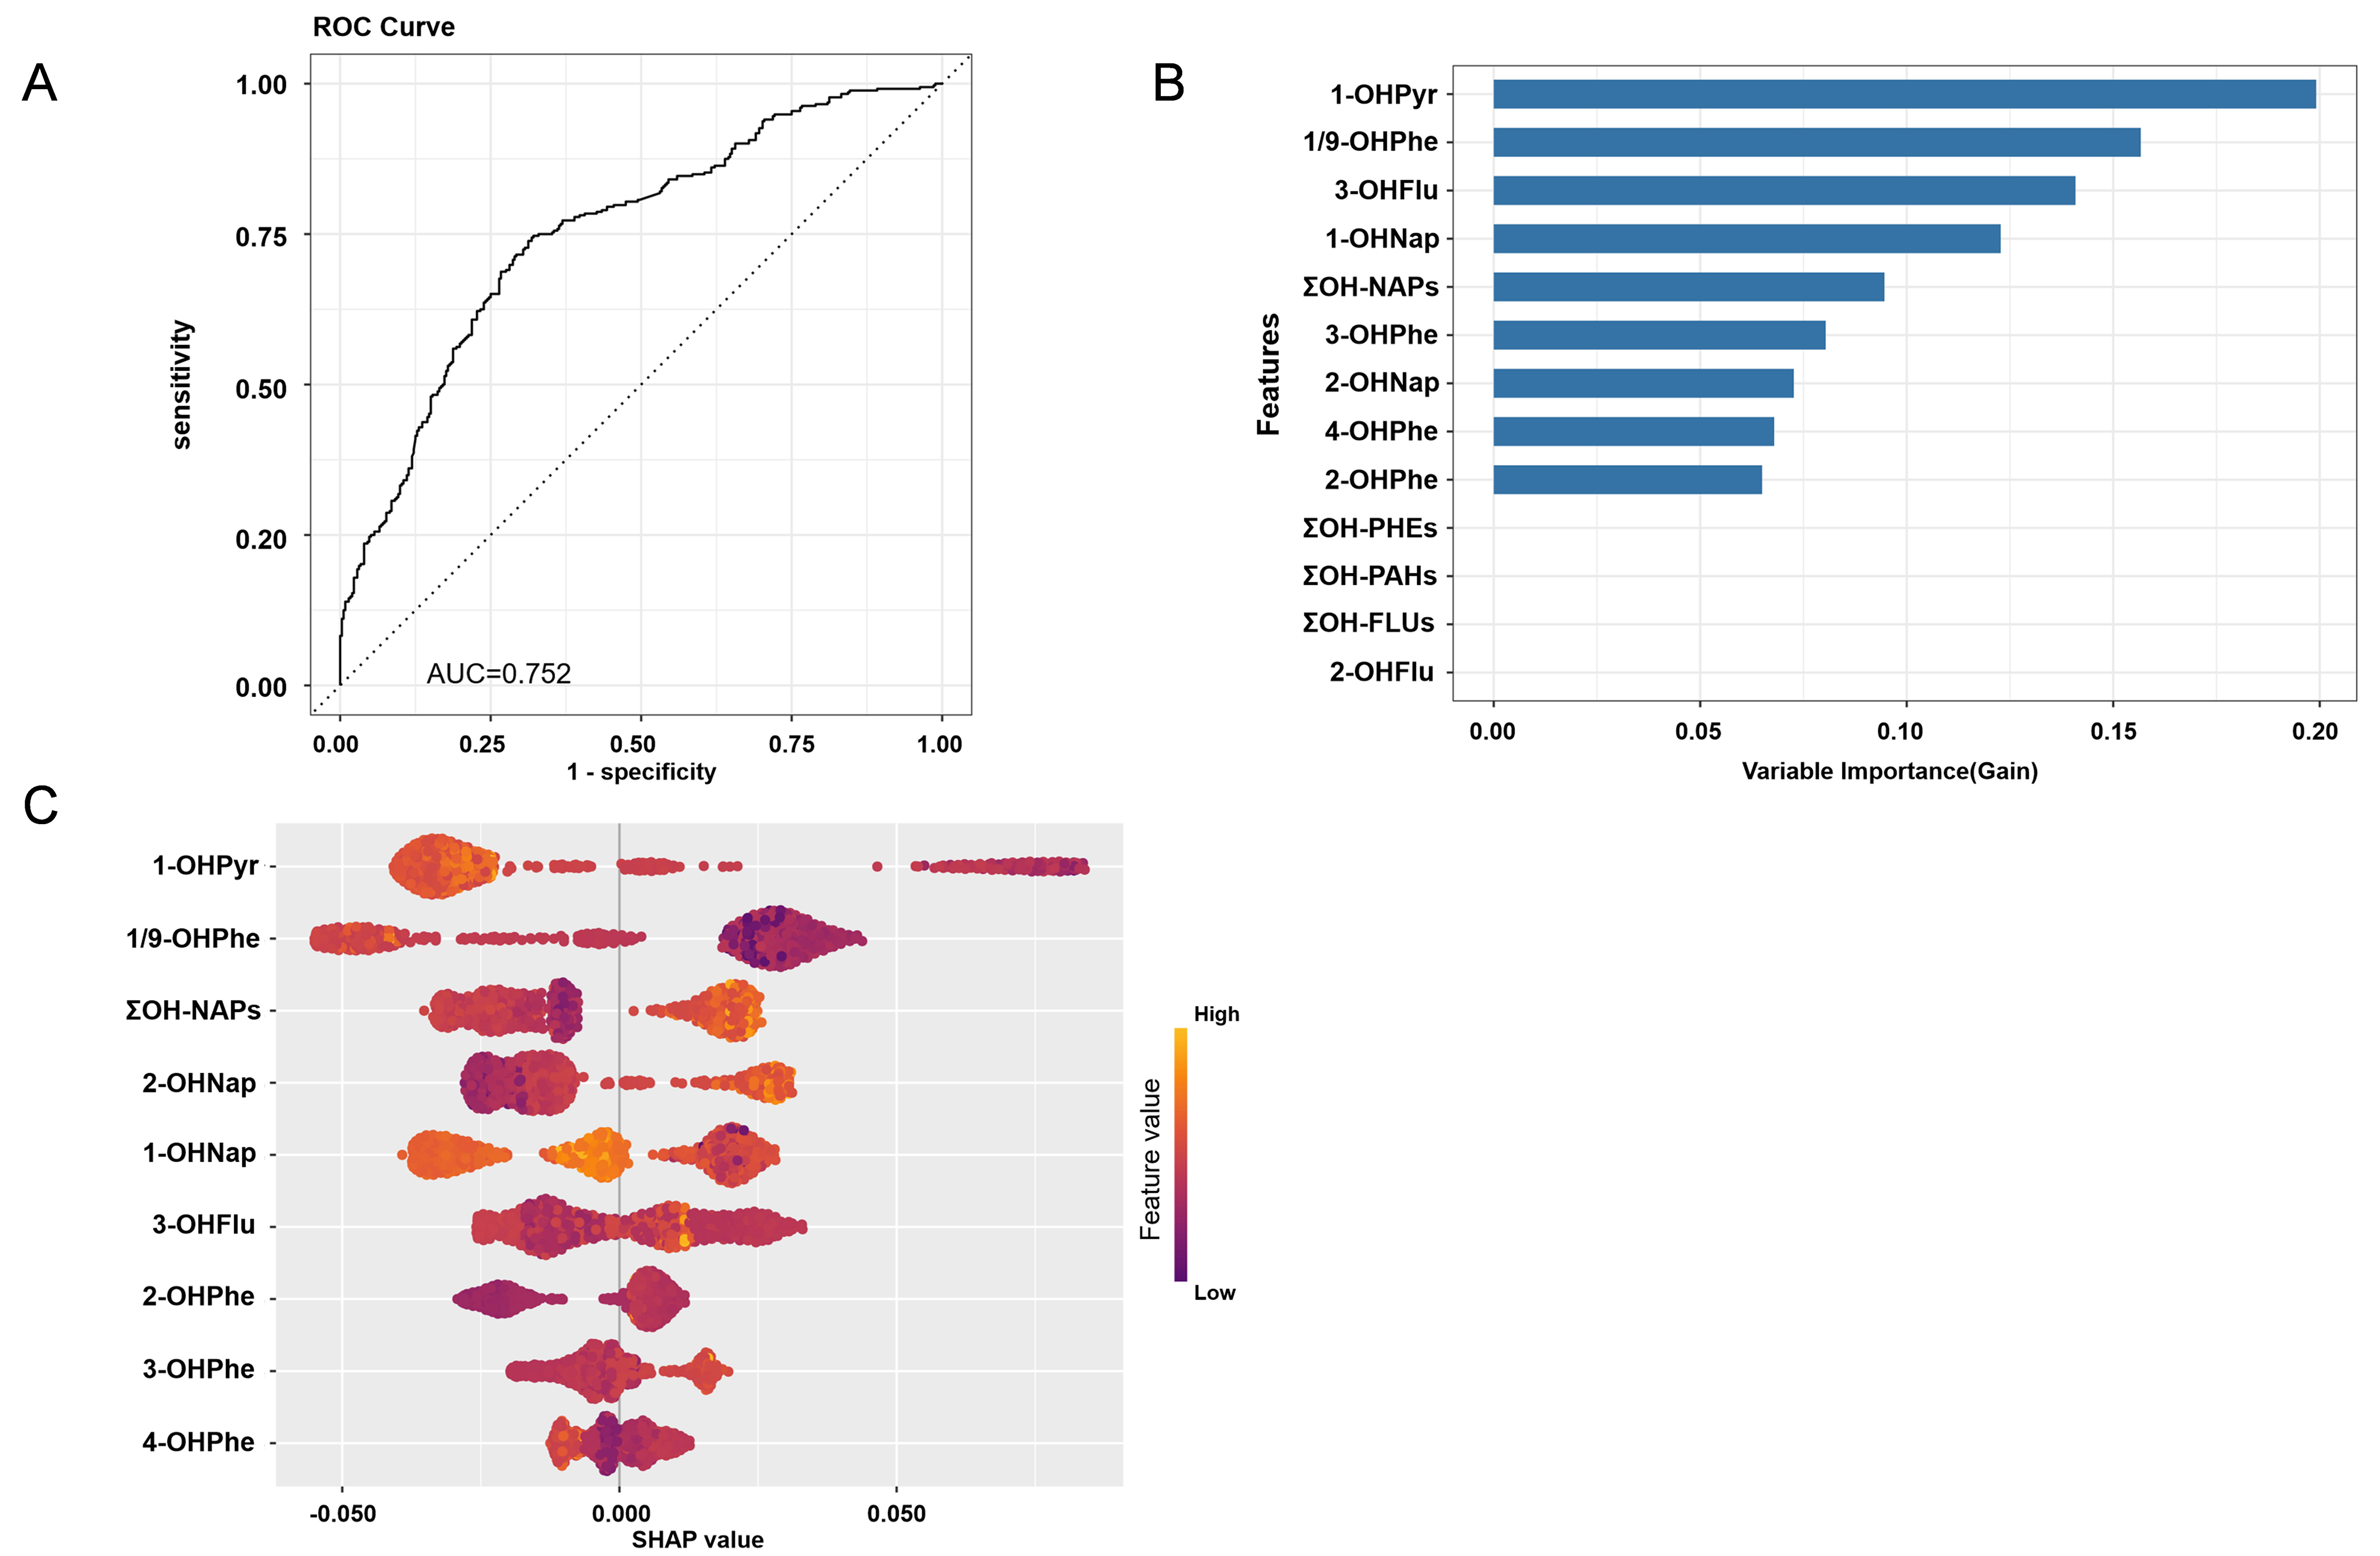
Figure 3. Predictive performance and feature contribution of the XGBoost model for anxiety symptoms. (A) ROC curve for prediction of anxiety symptoms; (B) Gain-based variable importance bar plot derived from XGBoost training; (C) SHAP beeswarm plot showing marginal effects of OH-PAH metabolites on prevalent anxiety-symptom status. Each dot represents one participant, colored by pollutant exposure level (red = high, blue = low); horizontal SHAP values indicate elevated (positive) or reduced (negative) odds for prevalent anxiety symptoms, with features ordered by mean absolute SHAP values. XGBoost: extreme gradient boosting; ROC: receiver operating characteristic; SHAP: SHapley Additive exPlanations; OH-PAH: hydroxylated polycyclic aromatic hydrocarbon; AUC: area under the receiver operating characteristic (ROC) curve; 1-OHPyr: 1-hydroxypyrene; 1/9-OHPhe: 1/9-hydroxyphenanthrene; 3-OHFlu: 3-hydroxyfluorene; 1-OHNap: 1-hydroxynaphthalene; ΣOH-NAPs: sum of 1-OHNap and 2-OHNap; 3-OHPhe: 3-hydroxyphenanthrene; 2-OHNap: 2-hydroxynaphthalene; 4-OHPhe: 4-hydroxyphenanthrene; 2-OHPhe: 2-hydroxyphenanthrene; ΣOH-PHEs: sum of 1/9-OHPhe, 2-OHPhe, 3-OHPhe, and 4-OHPhe; ΣOH-PAHs: total sum of all nine urinary OH-PAH metabolites; ΣOH-FLUs: sum of 2-OHFlu and 3-OHFlu; 2-OHFlu: 2-hydroxyfluorene; 1-OHNap: 1-hydroxynaphthalene.