

fig3
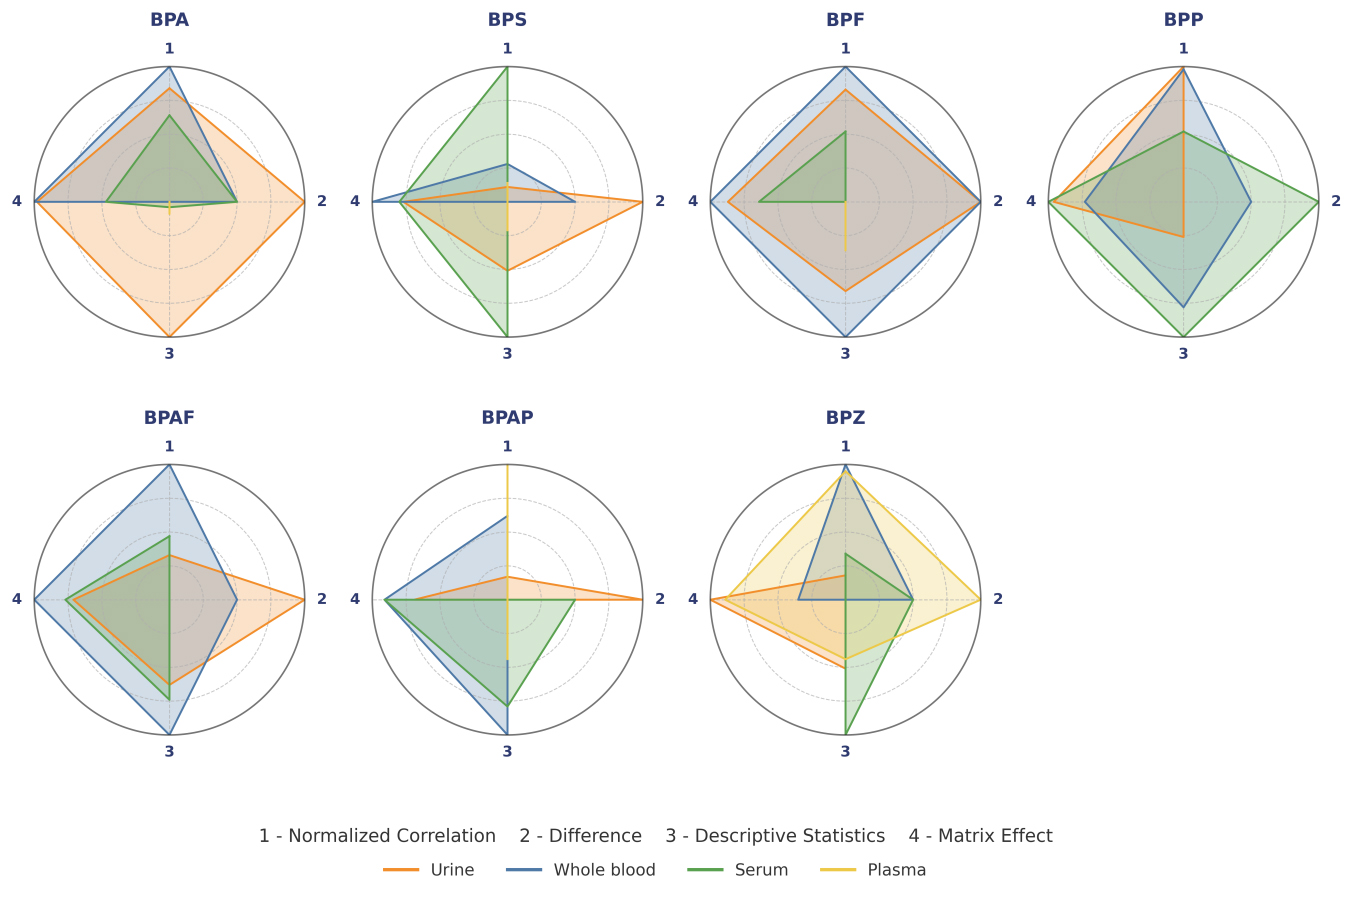
Figure 3. Comprehensive evaluation radar chart of biological matrices for BPs. This radar chart provides a comprehensive evaluation of the detection performance of BPs in different matrices across four key dimensions (range 0-1; higher is better). Normalized correlation reflects the degree of significant positive correlation between matrices. Difference represents the proportion of significant results based on the corrected Mann-Whitney U test. Descriptive statistics is an optimized indicator combining detection rate, mean concentration, and standard deviation. Matrix effect represents a composite score reflecting matrix interference and recovery rate. BP: Bisphenol; BPA: bisphenol A; BPS: bisphenol S; BPF: bisphenol F; BPP: bisphenol P; BPAF: bisphenol AF; BPAP: bisphenol AP; BPZ: bisphenol Z.


