fig2

Comparison of bisphenols in human urine, whole blood, serum and plasma: levels, optimal matrix identification and health risk

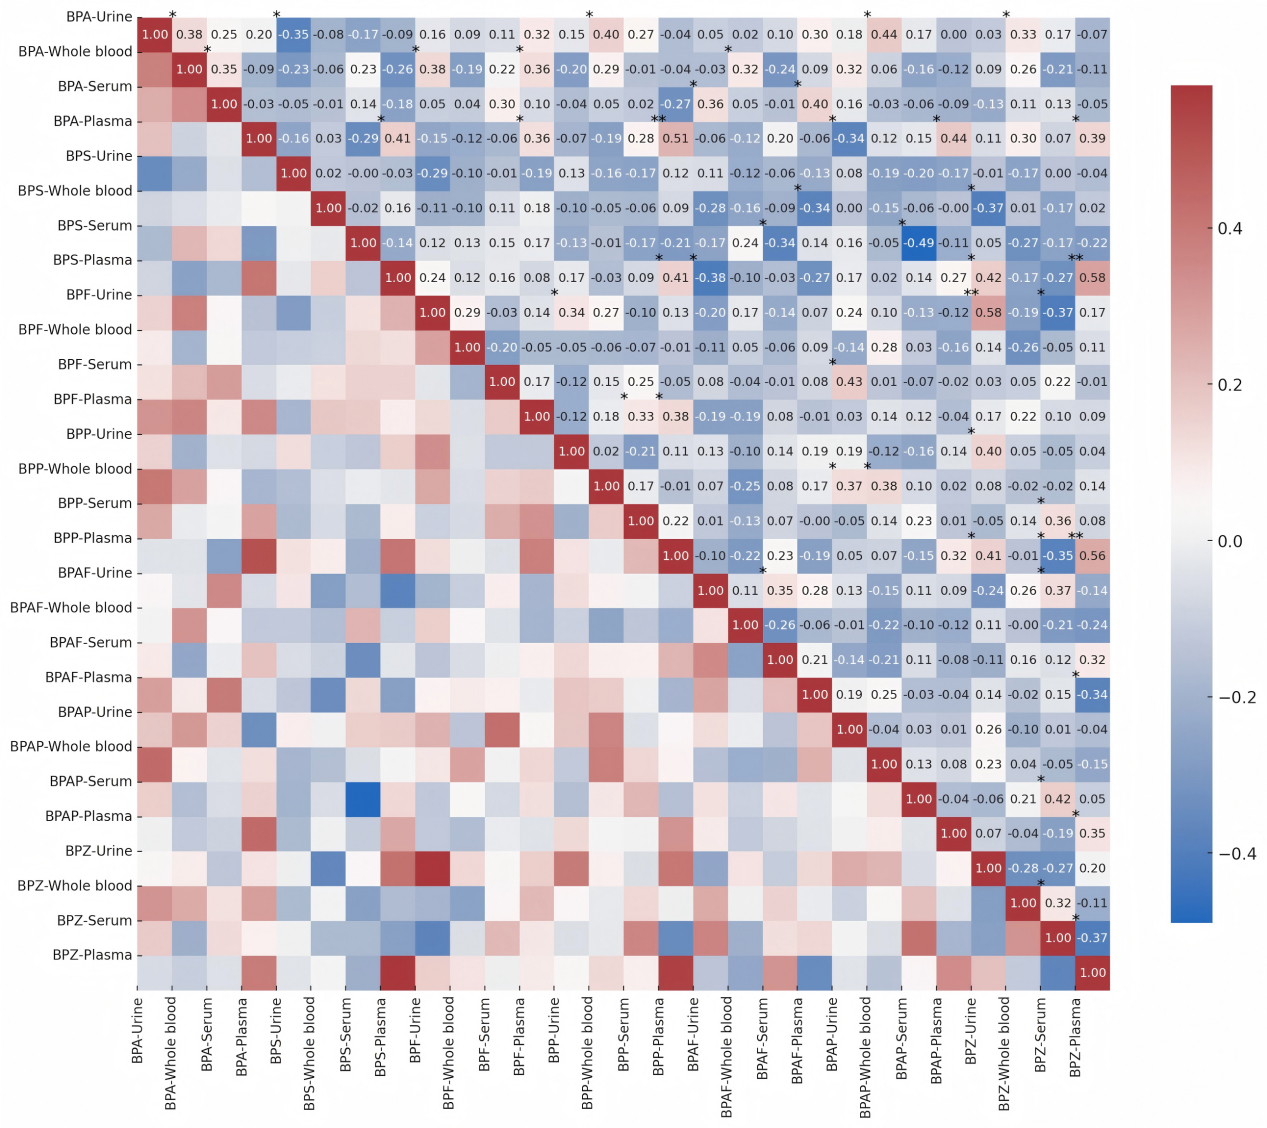
Figure 2. Spearman correlation between concentration levels of 7 BPs in 4 matrices. Significant variances are shown as *P < 0.05 and **P < 0.01, and are marked in the upper left of the corresponding squares. BP: Bisphenol; BPA: bisphenol A; BPS: bisphenol S; BPF: bisphenol F; BPP: bisphenol P; BPAF: bisphenol AF; BPAP: bisphenol AP; BPZ: bisphenol Z.

Journal of Environmental Exposure Assessment
ISSN 2771-5949 (Online)

Portico

All published articles are preserved here permanently:

https://www.portico.org/publishers/oae/

Portico

All published articles are preserved here permanently:

https://www.portico.org/publishers/oae/