

fig1
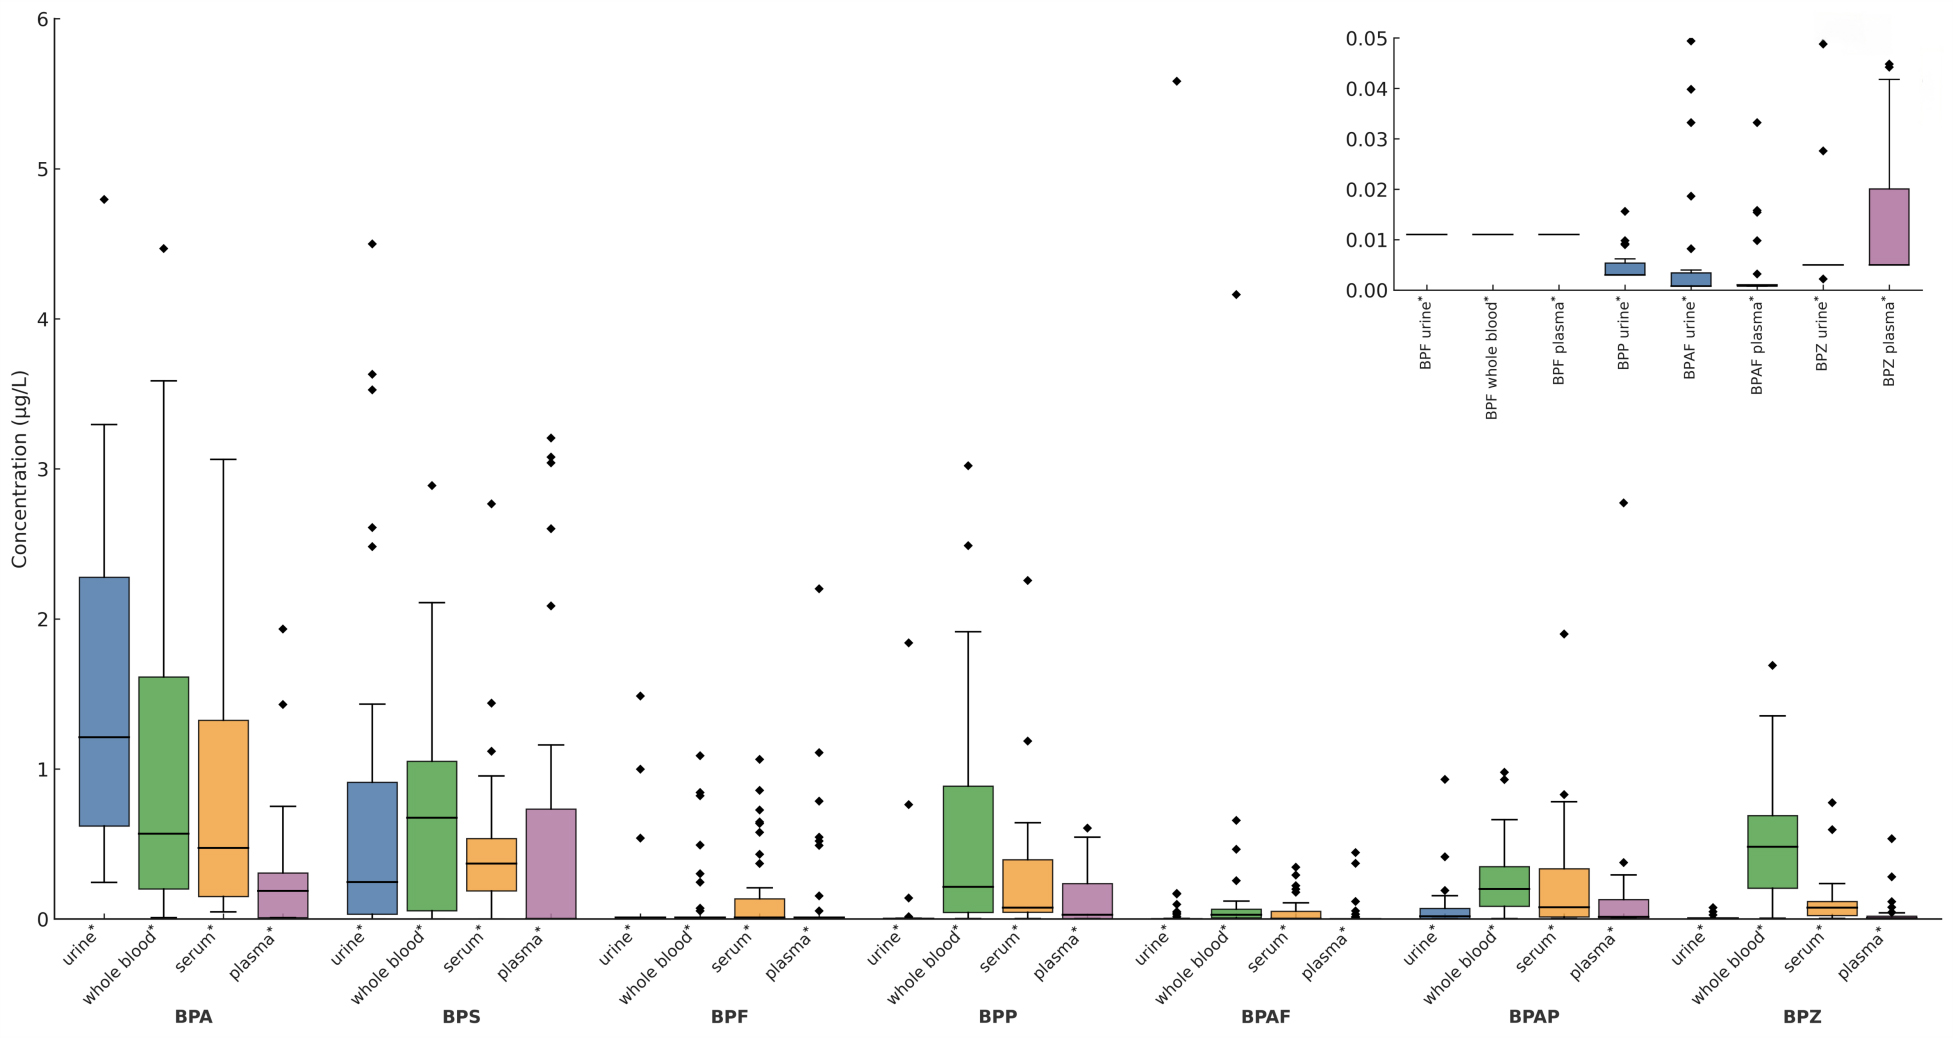
Figure 1. The content of 7 BPs in 4 matrices. The Mann-Whitney U test and the Bonferroni correction were used to compare the concentration levels of the same contaminant in four matrices. Significant differences in the amount of each contaminant between the paired samples are shown as *P < 0.05. BP: Bisphenol; BPA: bisphenol A; BPS: bisphenol S; BPF: bisphenol F; BPP: bisphenol P; BPAF: bisphenol AF; BPAP: bisphenol AP; BPZ: bisphenol Z.


