

fig2
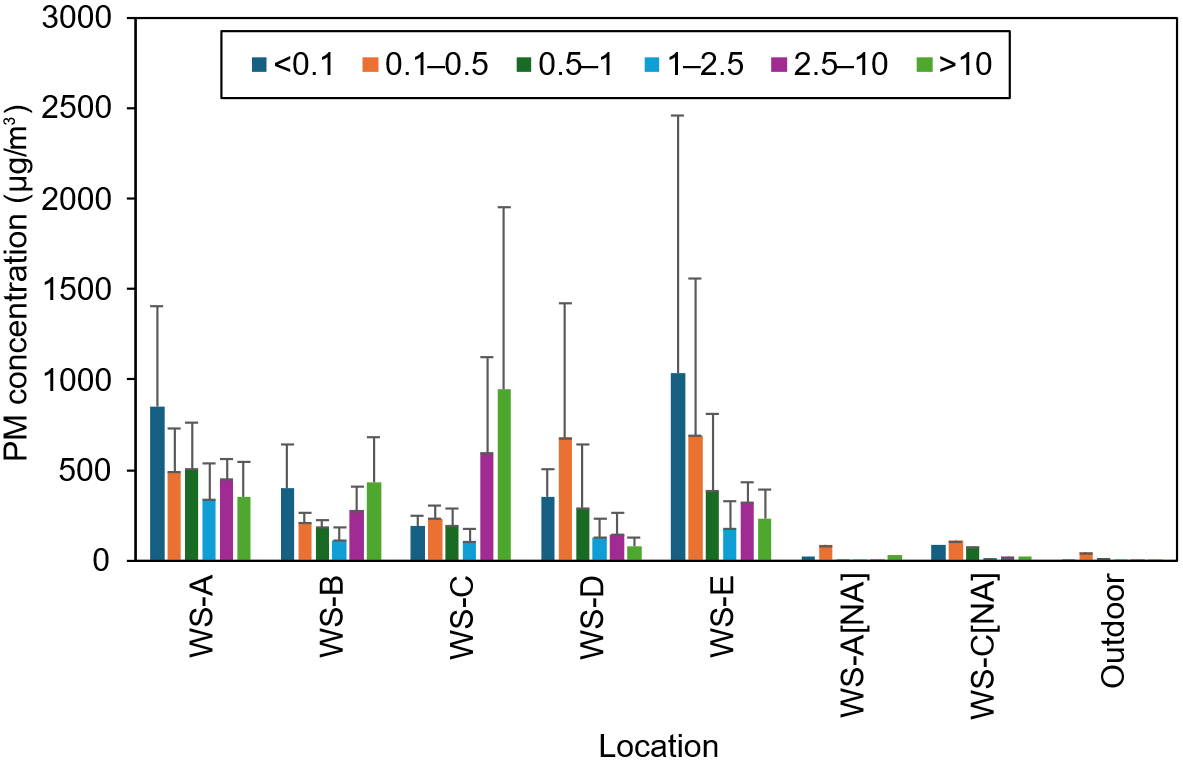
Figure 2. PM concentration (µg/m3) across different WSs (WS-A to WS-E) and the outdoor environment. The PM concentrations are categorized based on particle size ranges (< 0.1 µm, 0.1-0.5 µm, 0.5-1.0 µm, 1.0-2.5 µm, 2.5-10 µm, and > 10 µm). Error bars indicate the variability of PM levels. WS-A[NA] and WS-C[NA] represent periods with no activities in the respective WSs, providing a comparison of PM concentrations during operational and non-operational conditions. PM: Particulate matter; WS: workshop.


