

fig5
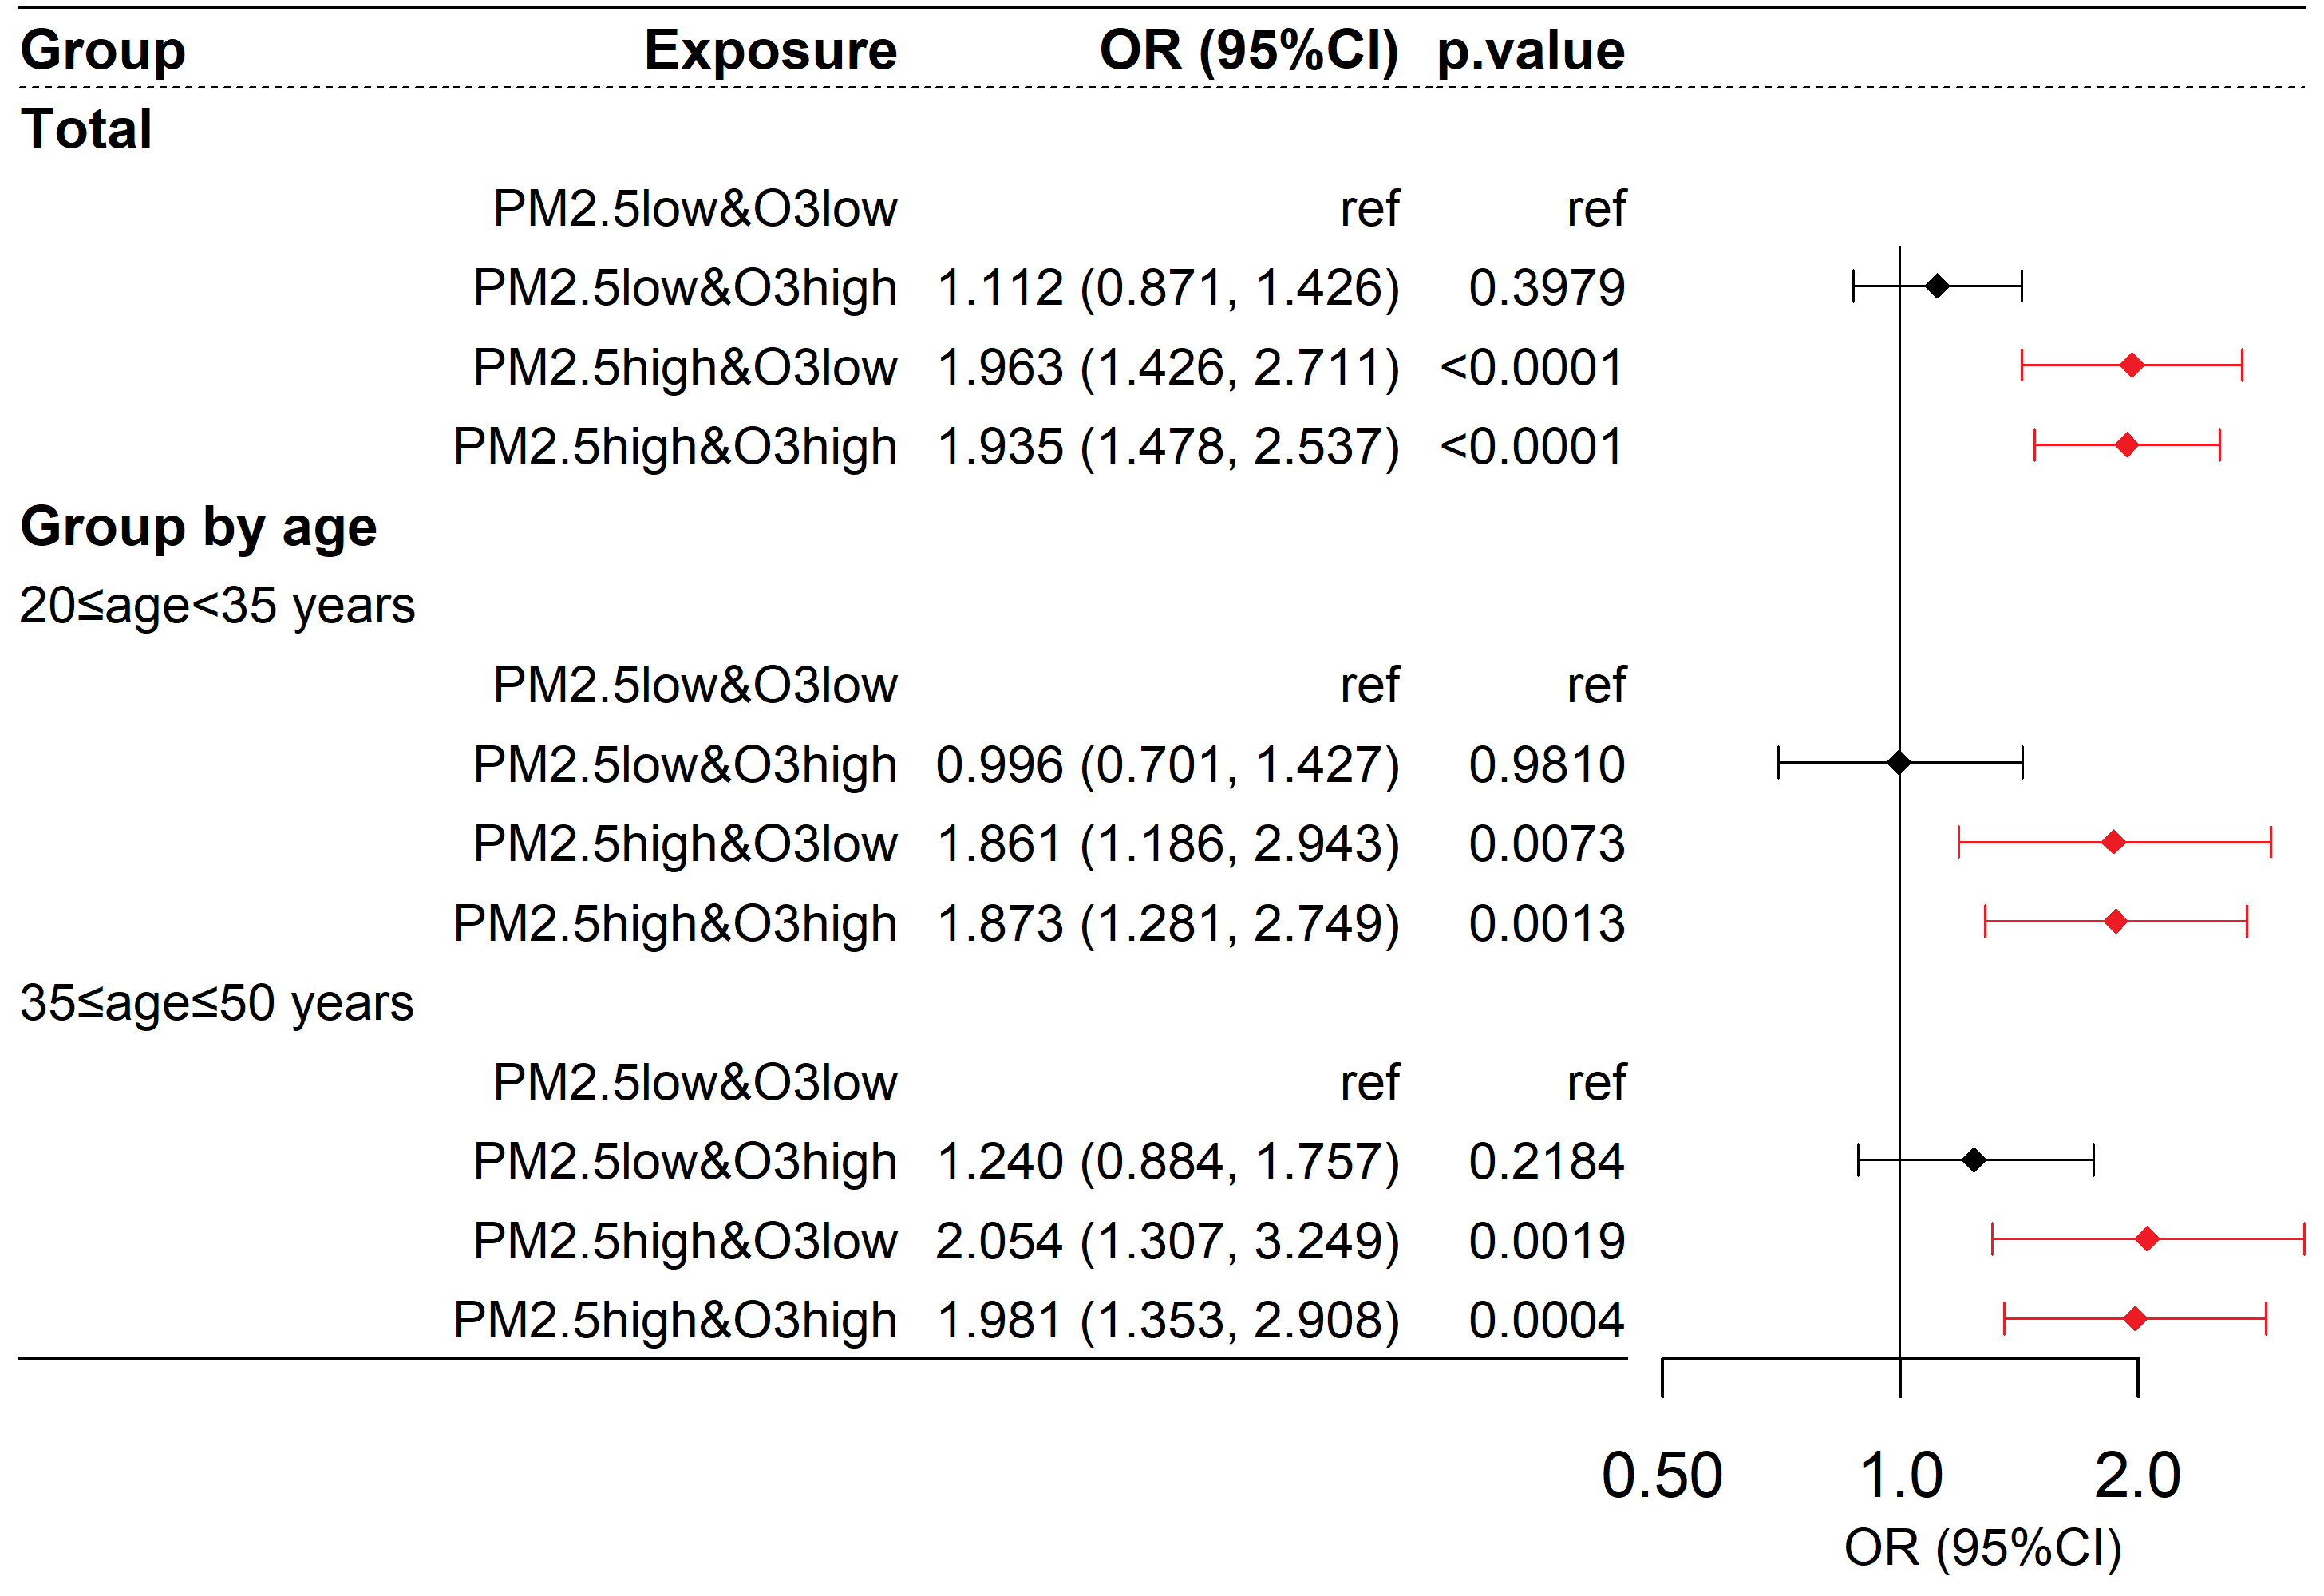
Figure 5. Risk of abnormal LDL-C among participants exposed to different combinations of PM2.5 and O3. Abnormal LDL-C is defined as LDL-C ≥ 4.1 mmol/L; the OR value represents the relative risk of participants being abnormal in LDL-C compared to the control group for each group. The model is as described in the methods section: logit(P) =


