

fig4
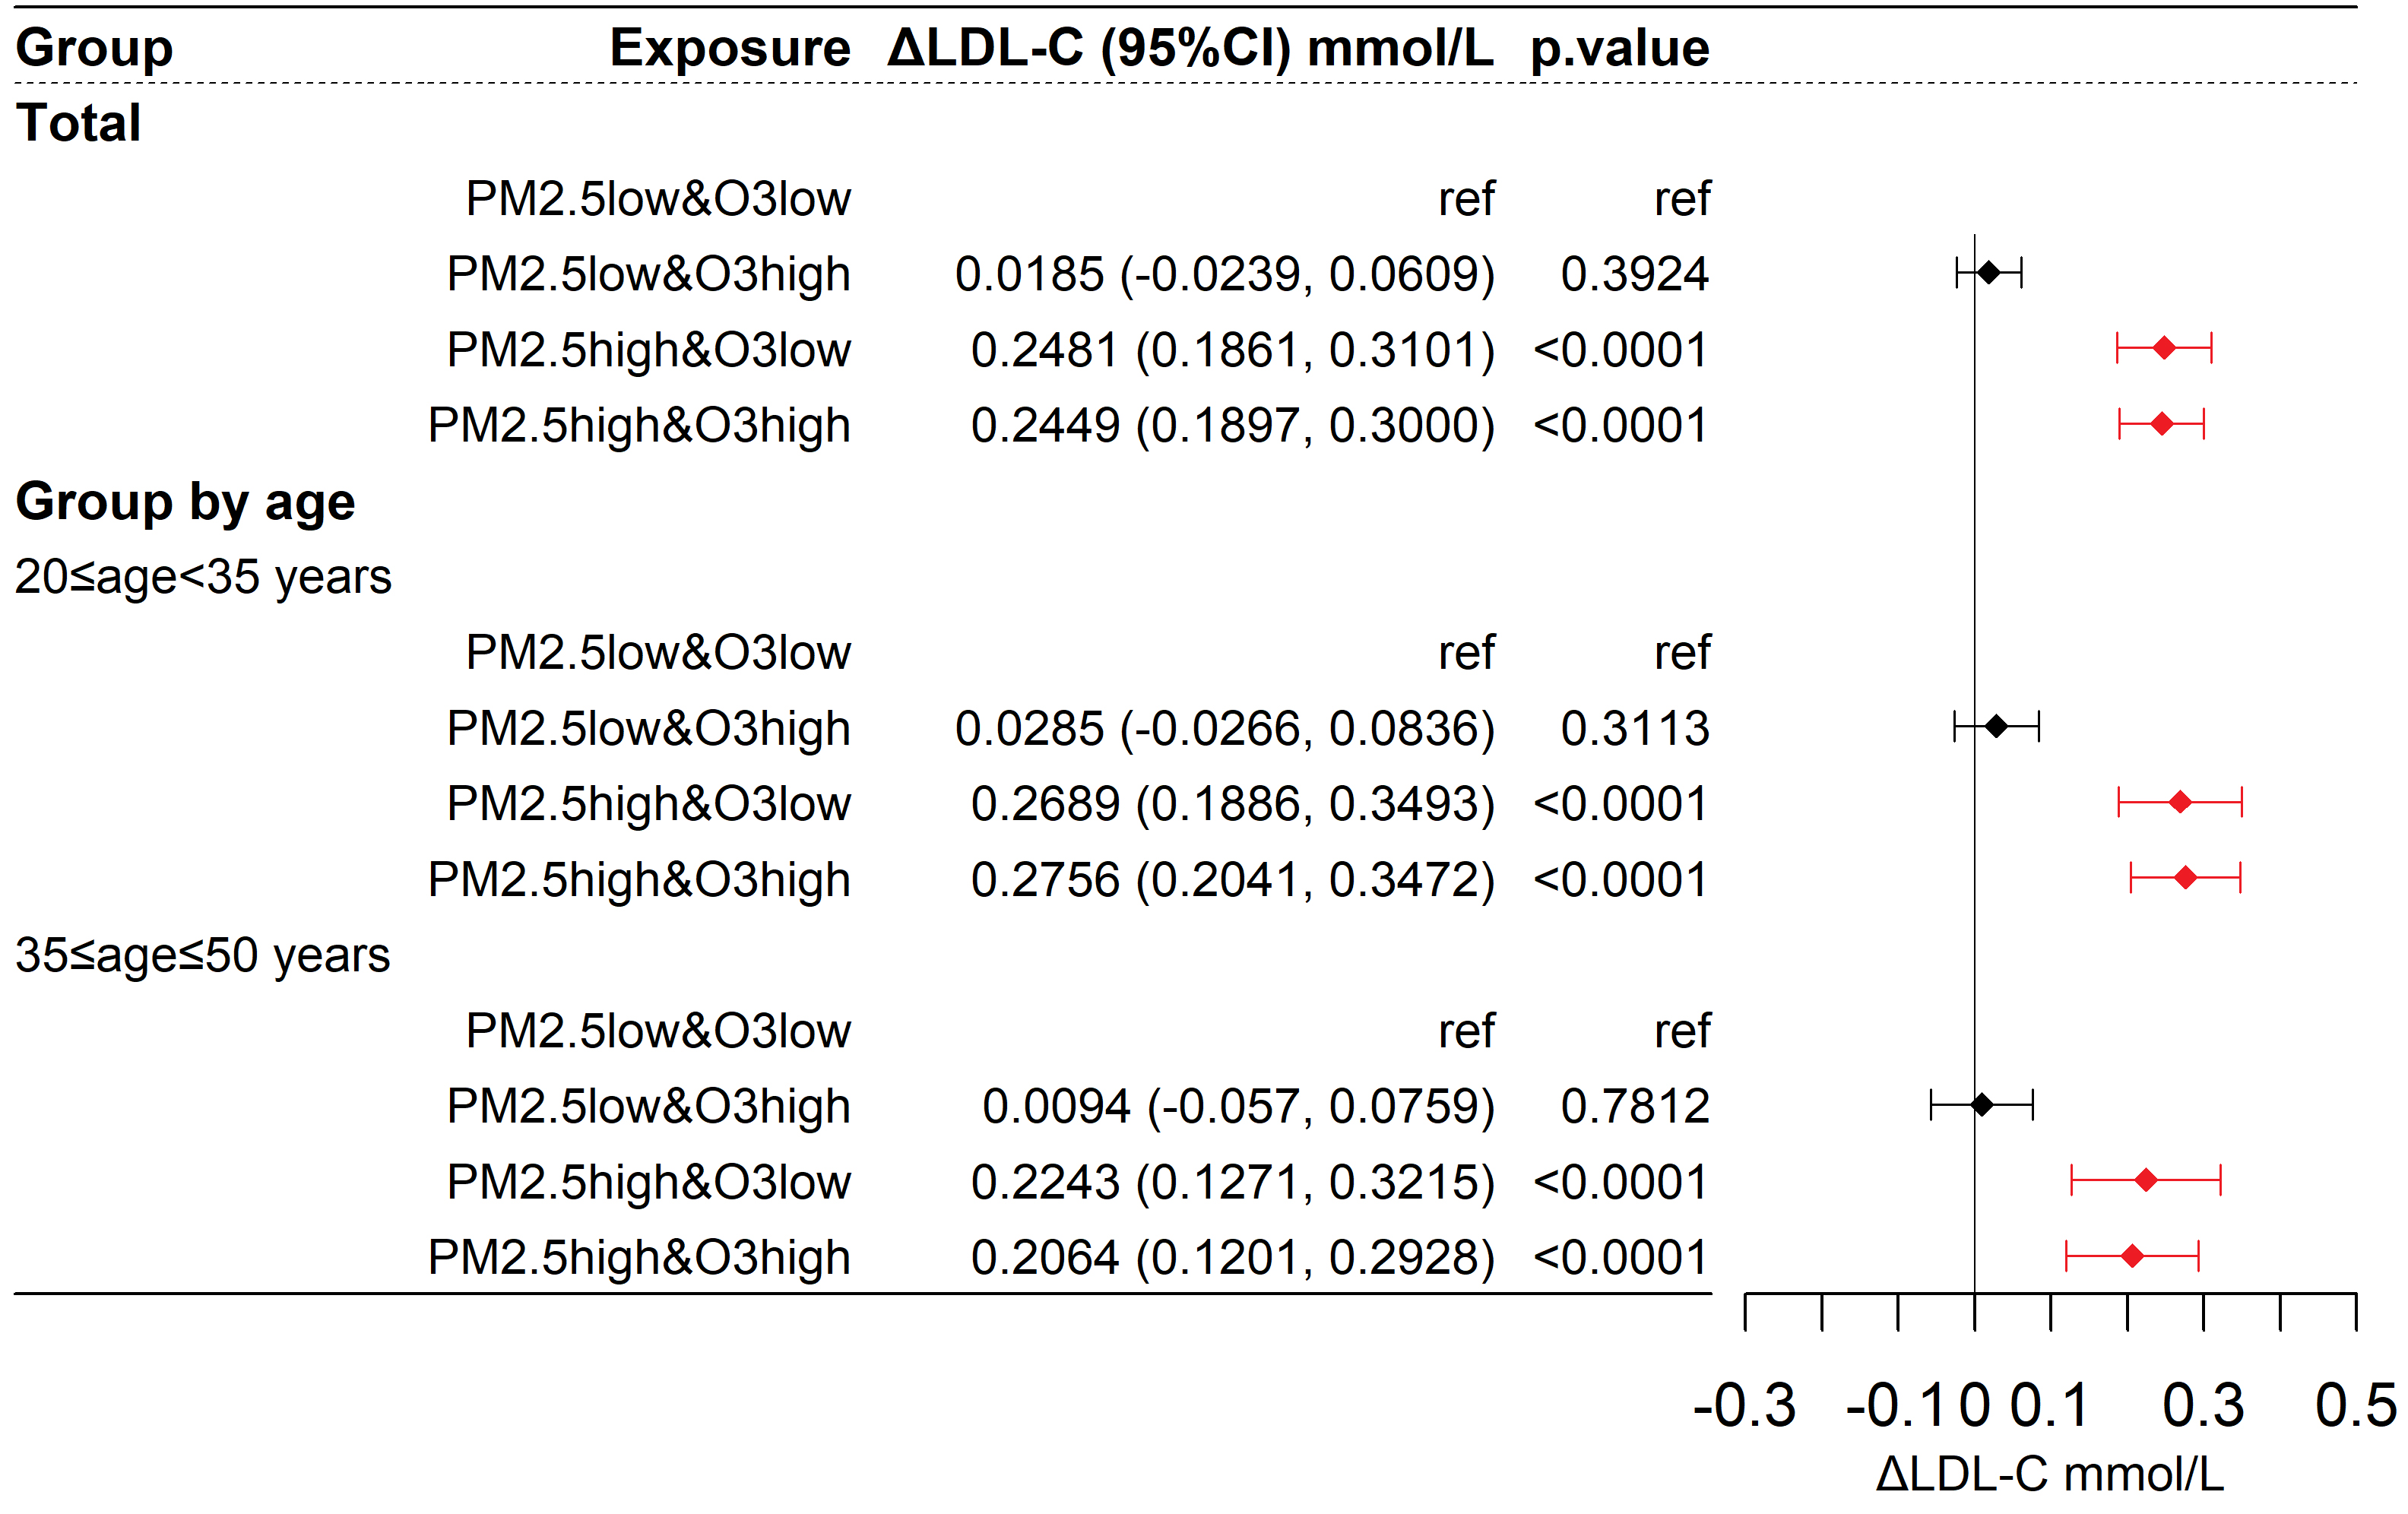
Figure 4. Differences in LDL-C among participants exposed to different combinations of PM2.5 and O3. ΔLDL-C represents the change in LDL-C compared to the control group. The model is as described in the methods section: LDL-C =Group + s(Age) + Season + Year + s(T) + s(RH) + s(FBG) + s(CK-MB) + s(CK) + s(ALT) + s(AST) + s(γ-GT) + s(Cr) + s(Urea). LDL-C: Low-density lipoprotein cholesterol; PM: particulate matter; O3: ozone; T: temperature; RH: relative humidity; FBG: fasting blood glucose; CK-MB: creatine kinase-MB; CK: creatine kinase; ALT: alanine aminotransferase; AST: aspartate aminotransferase; γ-GT: γ-glutamyl transferase; Cr: creatinine; Urea: blood urea nitrogen.


