

fig3
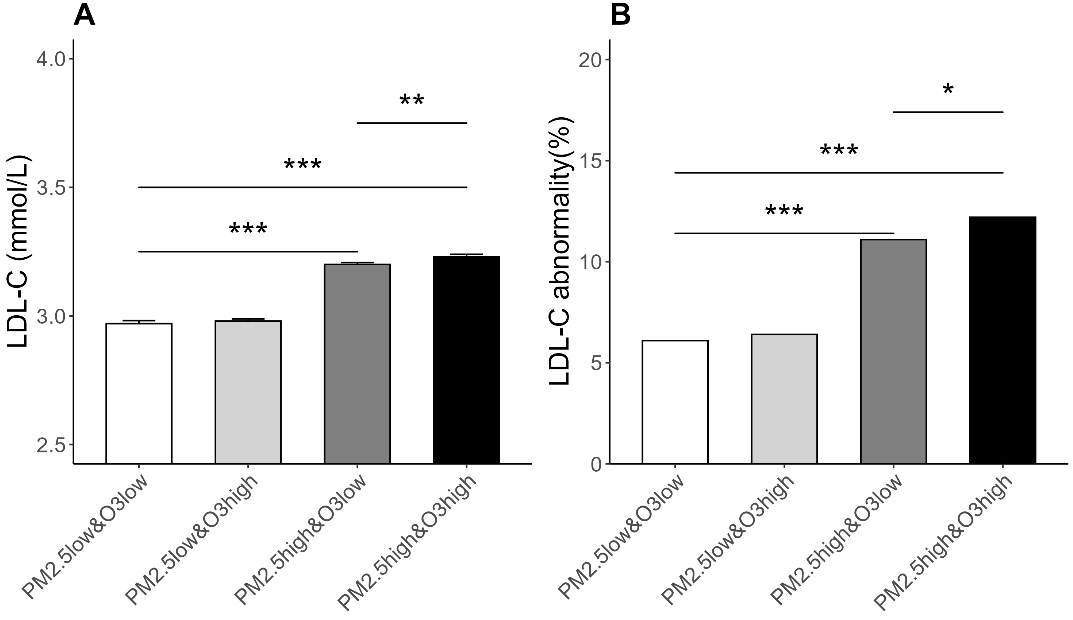
Figure 3. LDL-C Levels and Prevalence of Abnormal LDL-C among Participants Exposed to Different Combinations of PM2.5 and O3. (A) The vertical axis represents the LDL-C level, and the error bars represent the SE; SE = SD/
Figure 3. LDL-C Levels and Prevalence of Abnormal LDL-C among Participants Exposed to Different Combinations of PM2.5 and O3. (A) The vertical axis represents the LDL-C level, and the error bars represent the SE; SE = SD/


All published articles are preserved here permanently:
https://www.portico.org/publishers/oae/

