

fig2
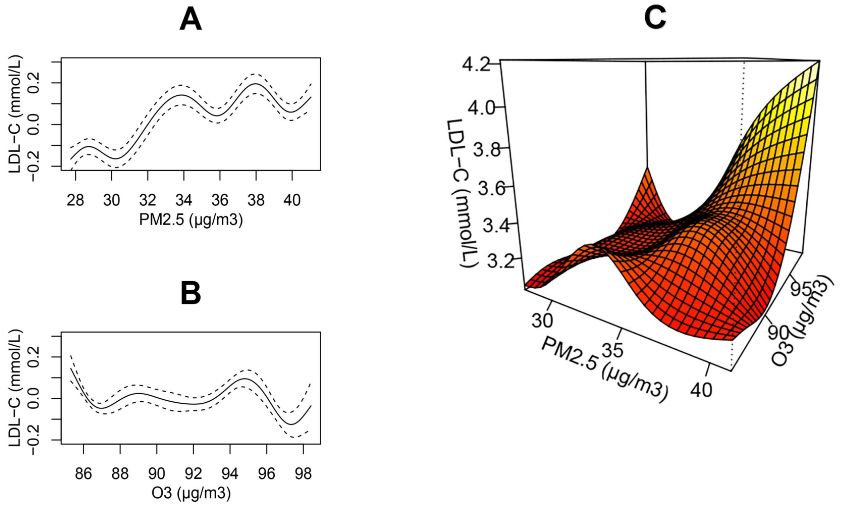
Figure 2. The smoothed trends in population LDL-C across the full distribution of PM2.5 and O3 concentrations. Panels A and B depict single-pollutant models of the form: LDL-C = s(PM2.5) [or s(O3)] + s(Age) + Season + Year + s(T) + s(RH) + s(FBG) + s(CK-MB) + s(CK) + s(ALT) + s(AST) + s(γ-GT) + s(Cr) + s(Urea). Panel C presents the two-pollutant model: LDL-C = ti(PM2.5) + ti(O3) + ti(PM2.5, O3) + s(Age) + Season + Year + s(T) + s(RH) + s(FBG) + s(CK-MB) + s(CK) + s(ALT) + s(AST) + s(γ-GT) + s(Cr) + s(Urea). Here, s(·) denotes spline smoothing for potential non-linear effects, and ti(·) denotes interaction terms that enable possible non-linear and non-additive joint effects of the two pollutants. LDL-C: Low-density lipoprotein cholesterol; PM: particulate matter; O3: ozone; T: temperature; RH: relative humidity; FBG: fasting blood glucose; CK-MB: creatine kinase-MB; CK: creatine kinase; ALT: alanine aminotransferase; AST: aspartate aminotransferase; γ-GT: γ-glutamyl transferase; Cr: creatinine; Urea: blood urea nitrogen.


