fig1

PM<sub>2.5</sub> and O<sub>3</sub> co-exposure affecting serum LDL-C: evidence from epidemiology and animal models

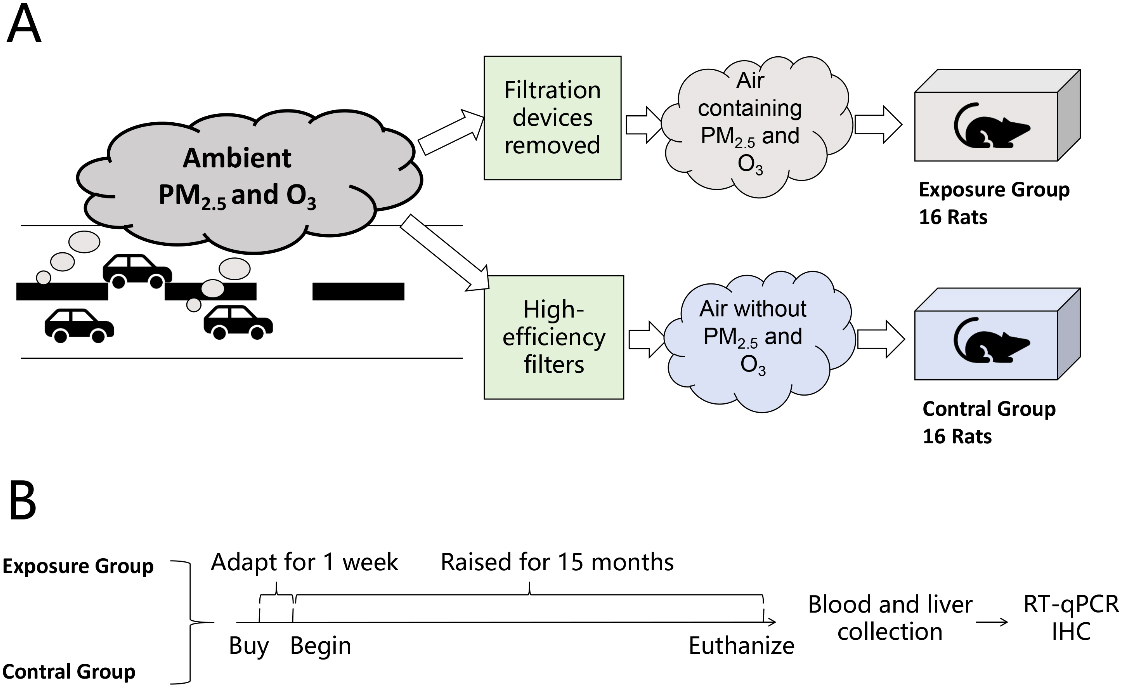
Figure 1. Schematic diagram of animal experiments. (A) Schematic diagram of exposure and control treatment; (B) Flowchart of the experimental procedure. RT-qPCR:Reverse transcription quantitative polymerase chain reaction; IHC: immunohistochemistry; PM: particulate matter; O3: ozone.

Journal of Environmental Exposure Assessment
ISSN 2771-5949 (Online)

Portico

All published articles are preserved here permanently:

https://www.portico.org/publishers/oae/

Portico

All published articles are preserved here permanently:

https://www.portico.org/publishers/oae/