fig6

Homeostasis of β<sub>2</sub>-microglobulin in diabetics and non-diabetics with modest cadmium intoxication

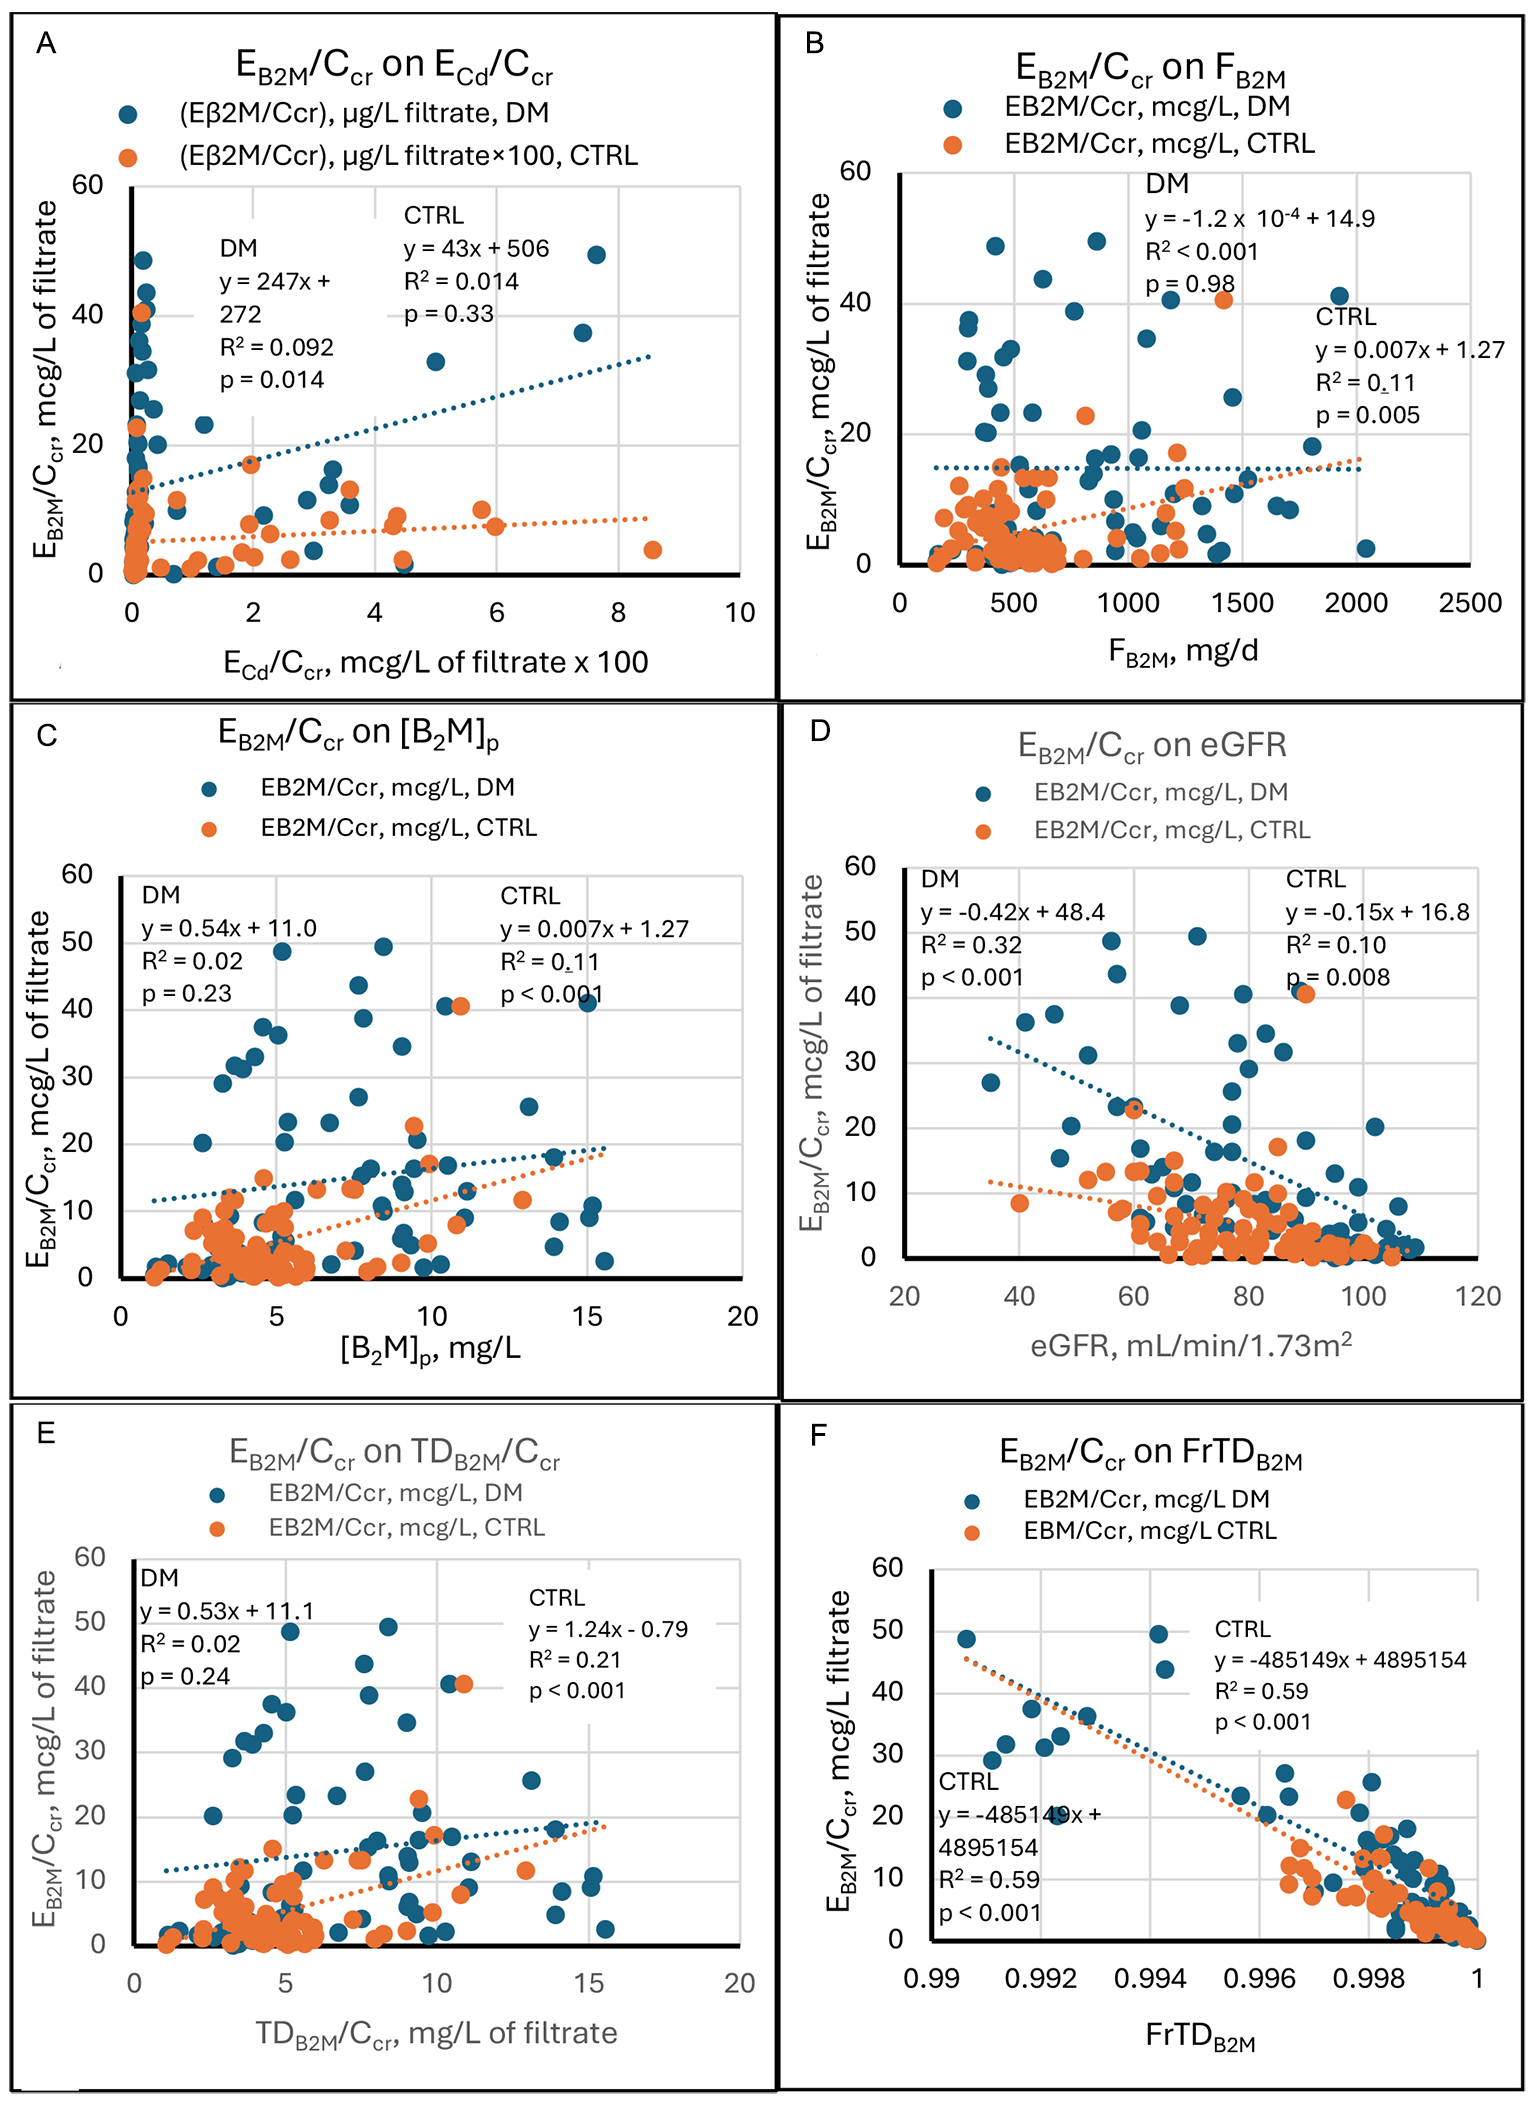
Figure 6. Linear regressions of Eβ2M/Ccr on potential determinants. Scatter diagrams present data from diabetics (DM, blue) and non-diabetic controls (CTRL, orange). The graphs plot Eβ2M/Ccr against (A) ECd/Ccr, (B) Fβ2M, (C) [β2M]s, (D) eGFR, (E) TDβ2M/Ccr, and (F) FrTDβ2M. In (A), a positive relationship is evident in DM, and no relationship is evident in CTRL. In (B) and (C), positive relationships are evident in CTRL, and no relationships are evident in DM. Inverse relationships are evident in both groups in (D). In (E), a positive relationship is evident in CTRL, and no relationship is evident in DM. In (F), strong inverse relationships are evident in both groups. Cd: Cadmium; cr: creatinine; β2M: β2-microglobulin; Eβ2M/Ccr: amount of β2M excreted per volume of glomerular filtrate; DM: group with diabetes mellitus; CTRL: control group without diabetes; ECd/Ccr: amount of Cd excreted per volume of glomerular filtrate; Fβ2M: rate of glomerular filtration of β2M; [β2M]s: serum concentration of β2M; eGFR: estimated glomerular filtration rate; TDβ2M/Ccr: amount of β2M undergoing tubular degradation per volume of glomerular filtrate; FrTDβ2M: fractional tubular degradation of filtered β2M.

Journal of Environmental Exposure Assessment
ISSN 2771-5949 (Online)

Portico

All published articles are preserved here permanently:

https://www.portico.org/publishers/oae/

Portico

All published articles are preserved here permanently:

https://www.portico.org/publishers/oae/