

fig5
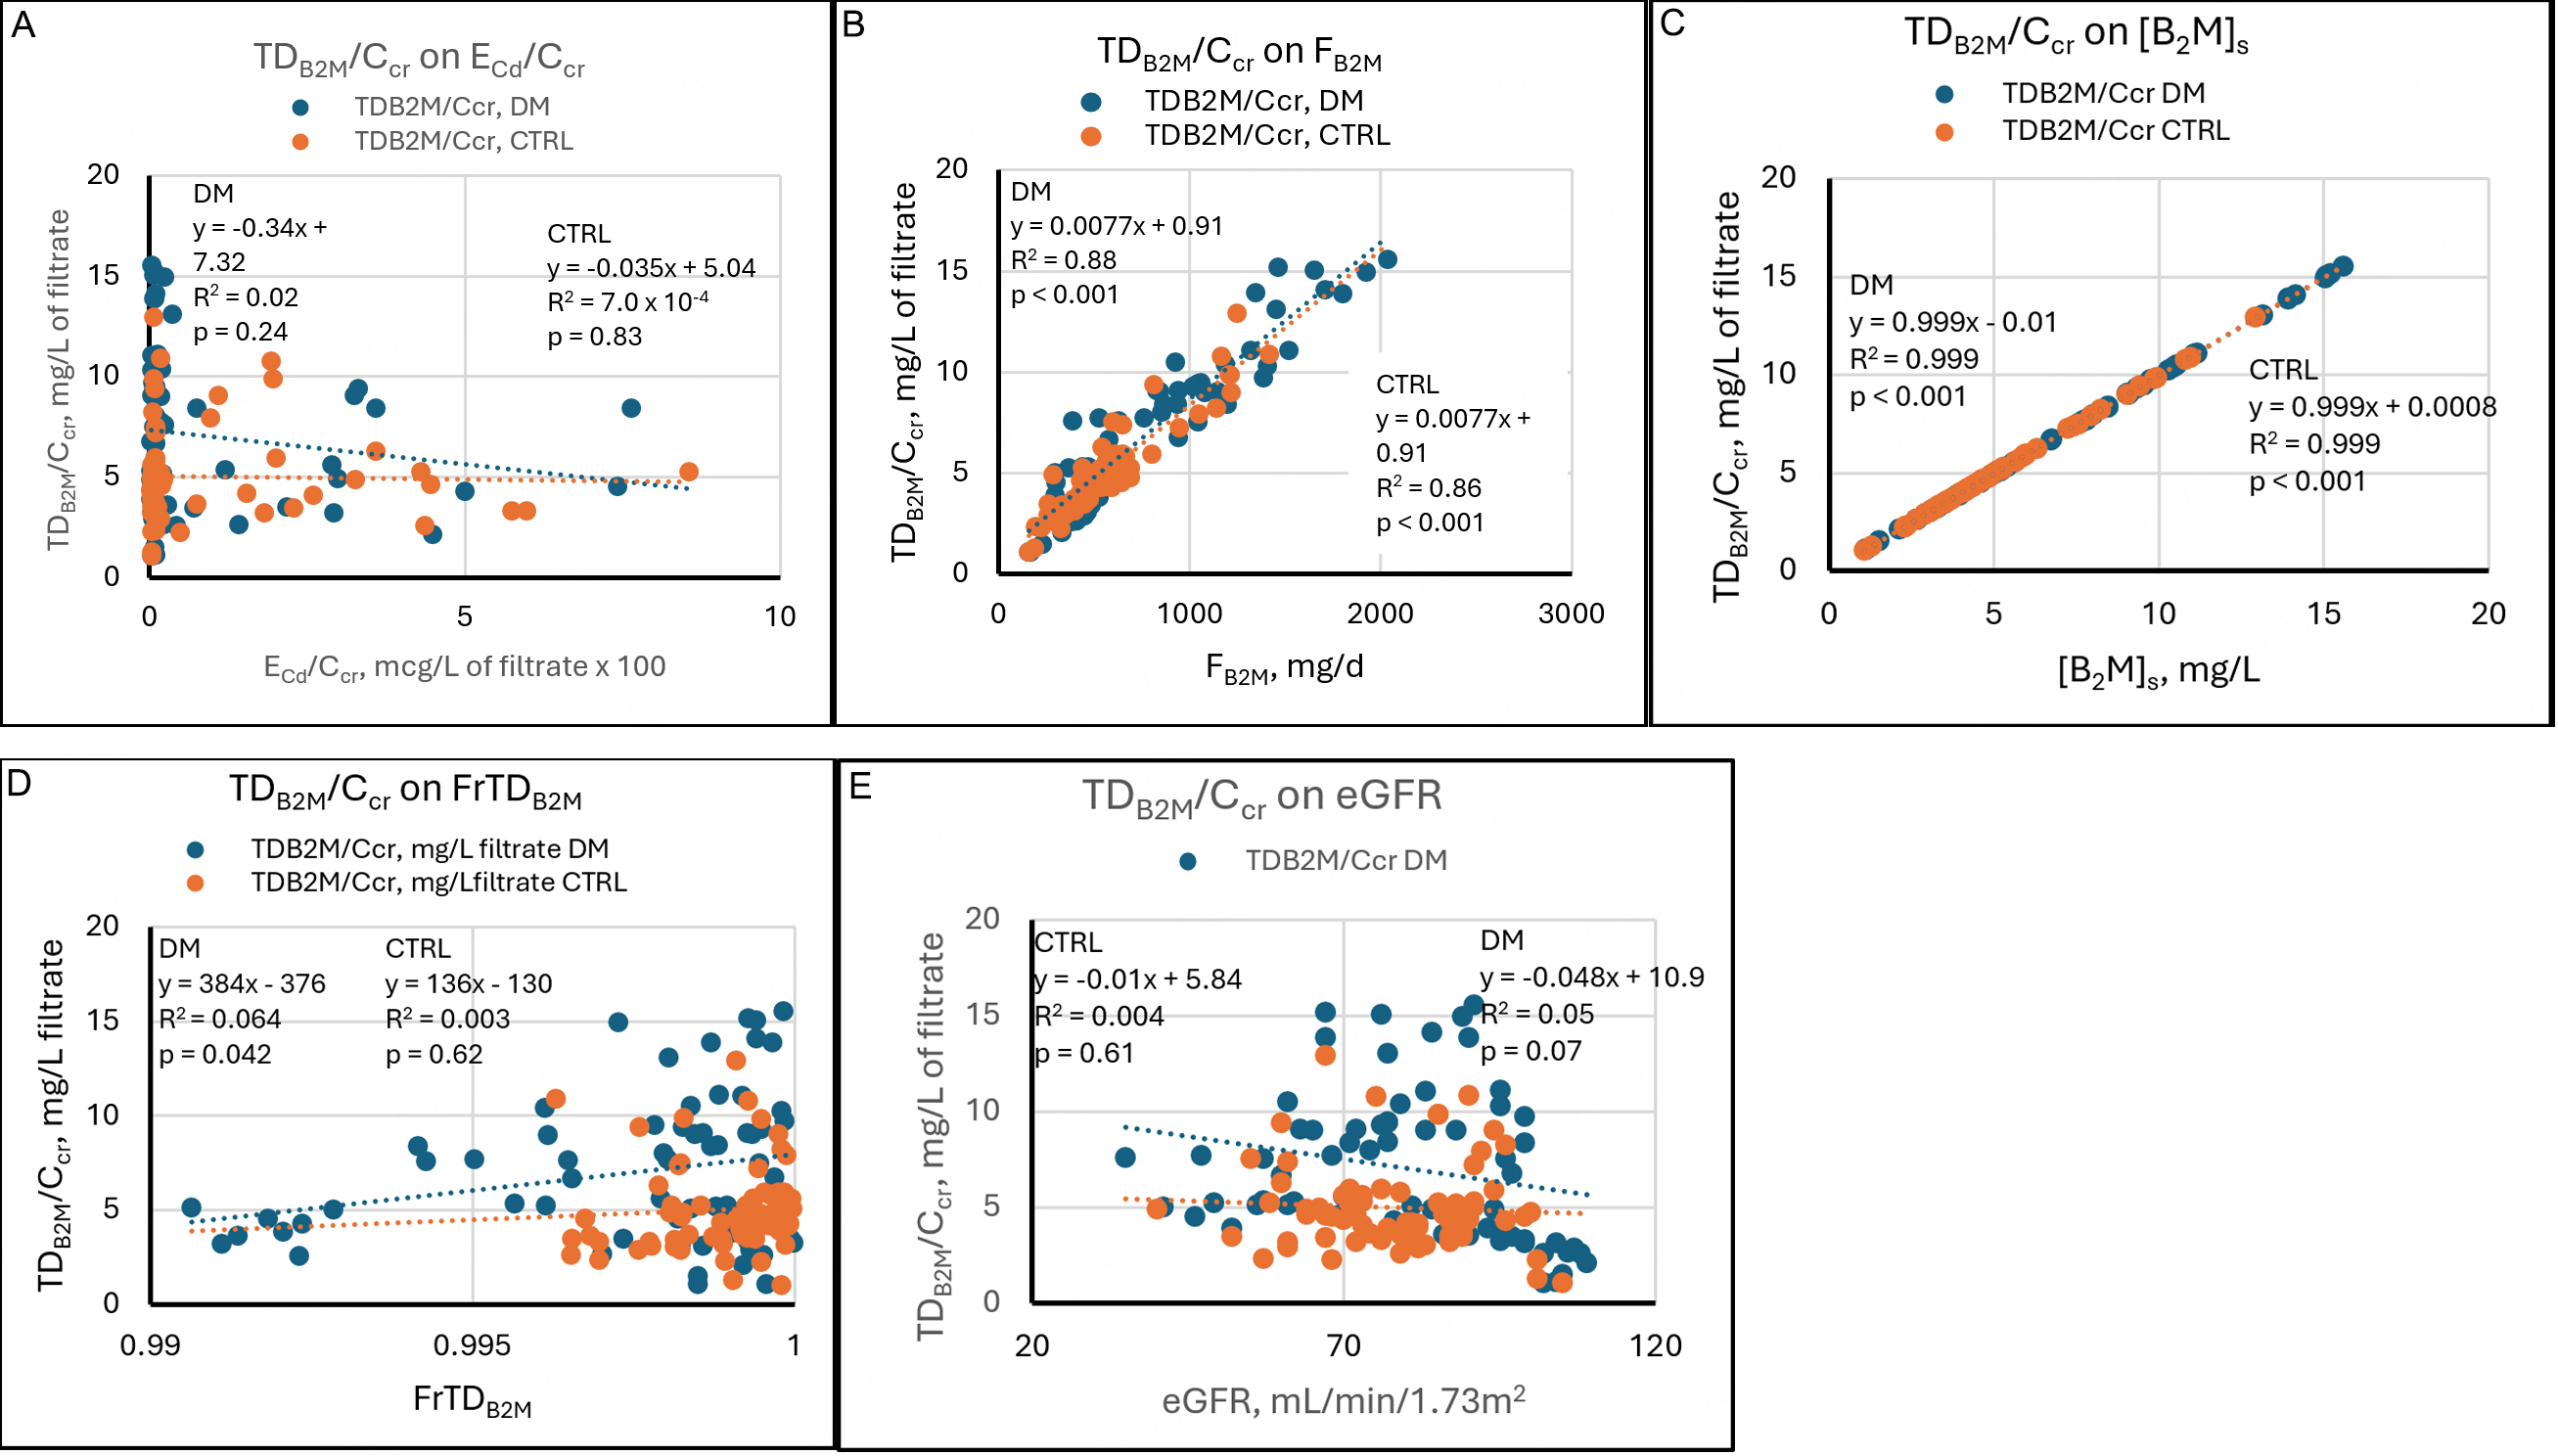
Figure 5. Linear regressions of TDβ2M/Ccr on potential determinants. Scatter diagrams present data from diabetics (DM, blue) and non-diabetic controls (CTRL, orange). The graphs plot TDβ2M/Ccr against (A) ECd/Ccr, (B) Fβ2M, (C) [β2M]s, (D) FrTDβ2M, and (E) eGFR. No relationships are evident in (A). Strong direct relationships are evident in both groups in (B) and (C). In (D), a direct relationship is evident in DM, and no relationship is evident in CTRL. In (E), a marginal inverse relationship is evident in DM, and no relationship is evident in CTRL. Cd: Cadmium; cr: creatinine; β2M: β2-microglobulin; TDβ2M/Ccr: amount of β2M undergoing tubular degradation per volume of glomerular filtrate; DM: group with diabetes mellitus; CTRL: control group without diabetes; ECd/Ccr: amount of Cd excreted per volume of glomerular filtrate; Fβ2M: rate of glomerular filtration of β2M; [β2M]s: serum concentration of β2M; FrTDβ2M: fractional tubular degradation of filtered β2M; eGFR: estimated glomerular filtration rate.


