

fig4
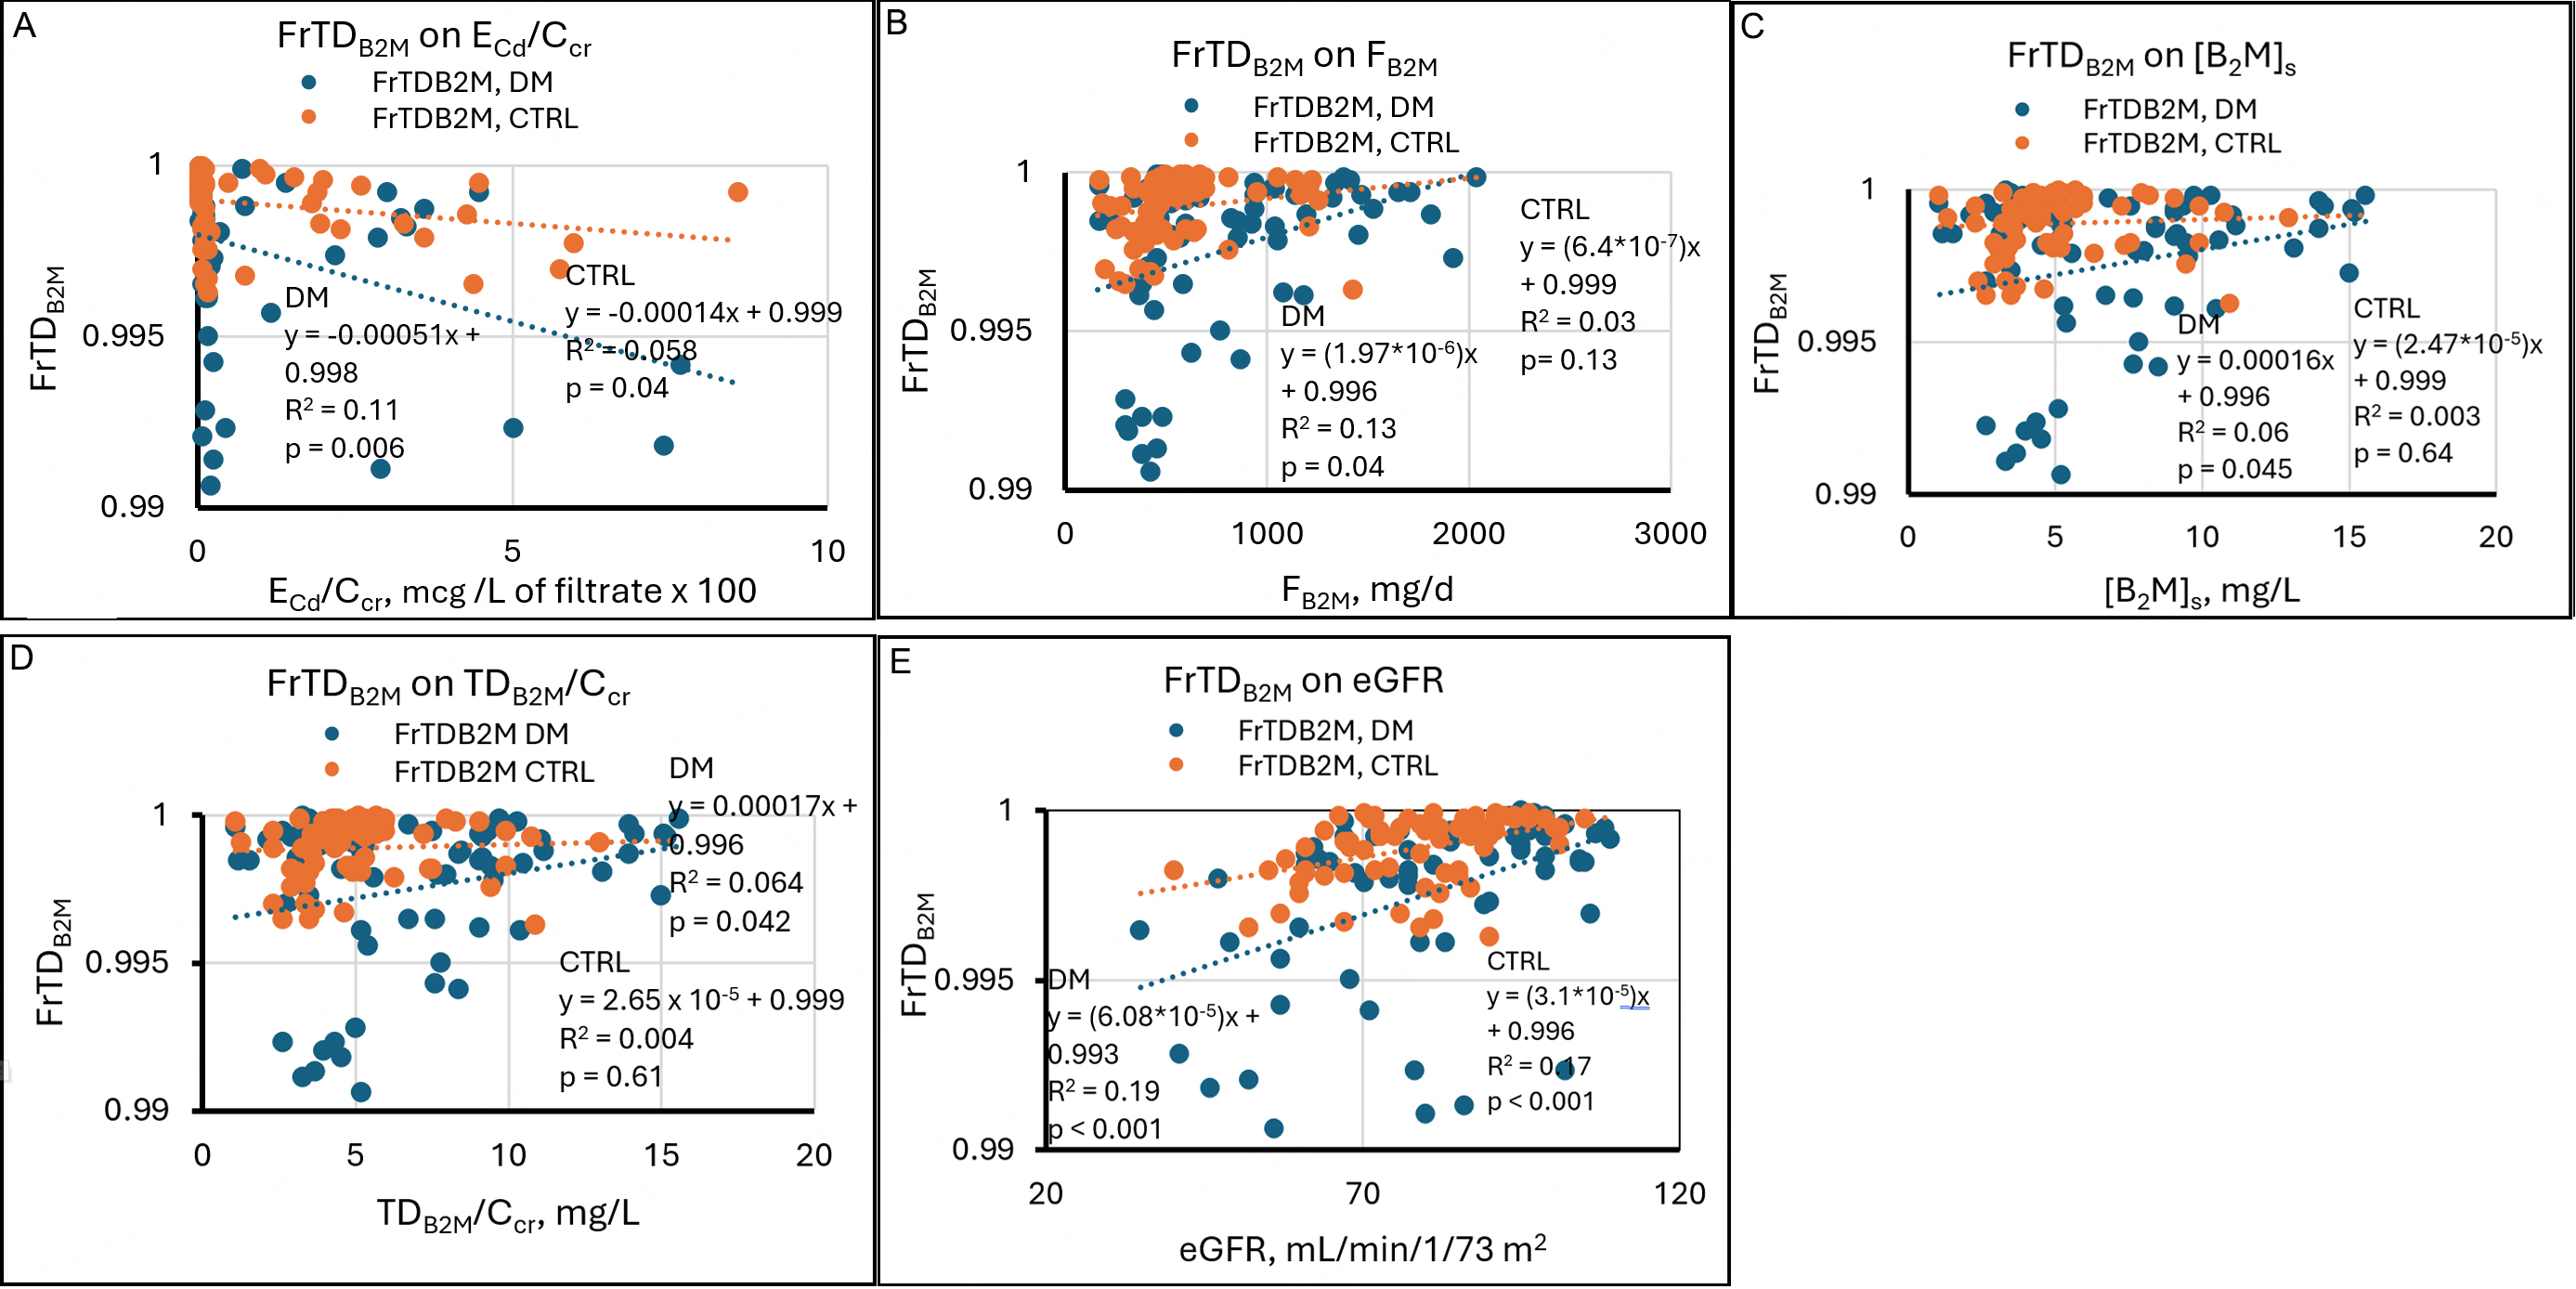
Figure 4. Linear regressions of FrTDβ2M on potential determinants. Scatter diagrams present data from diabetics (DM, blue) and non-diabetic controls (CTRL, orange). The graphs plot FrTDβ2M against (A) ECd/Ccr, (B) Fβ2M, (C) [β2M]s, (D) TDβ2M/Ccr, and (E) eGFR. Inverse relationships are evident in both groups in (A). In (B), a weak direct relationship is evident in DM, and no relationship is evident in CTRL. That pattern is repeated in (C) and (D). Direct relationships are evident in both groups in (E). Cd: Cadmium; cr: creatinine; β2M: β2-microglobulin; FrTDβ2M: fractional tubular degradation of filtered β2M; DM: group with diabetes mellitus; CTRL: control group without diabetes; ECd/Ccr: amount of Cd excreted per volume of glomerular filtrate; Fβ2M: rate of glomerular filtration of β2M; [β2M]s: serum concentration of β2M; TDβ2M/Ccr: amount of β2M undergoing tubular degradation per volume of glomerular filtrate; eGFR: estimated glomerular filtration rate.


