

fig1
From: Homeostasis of β2-microglobulin in diabetics and non-diabetics with modest cadmium intoxication
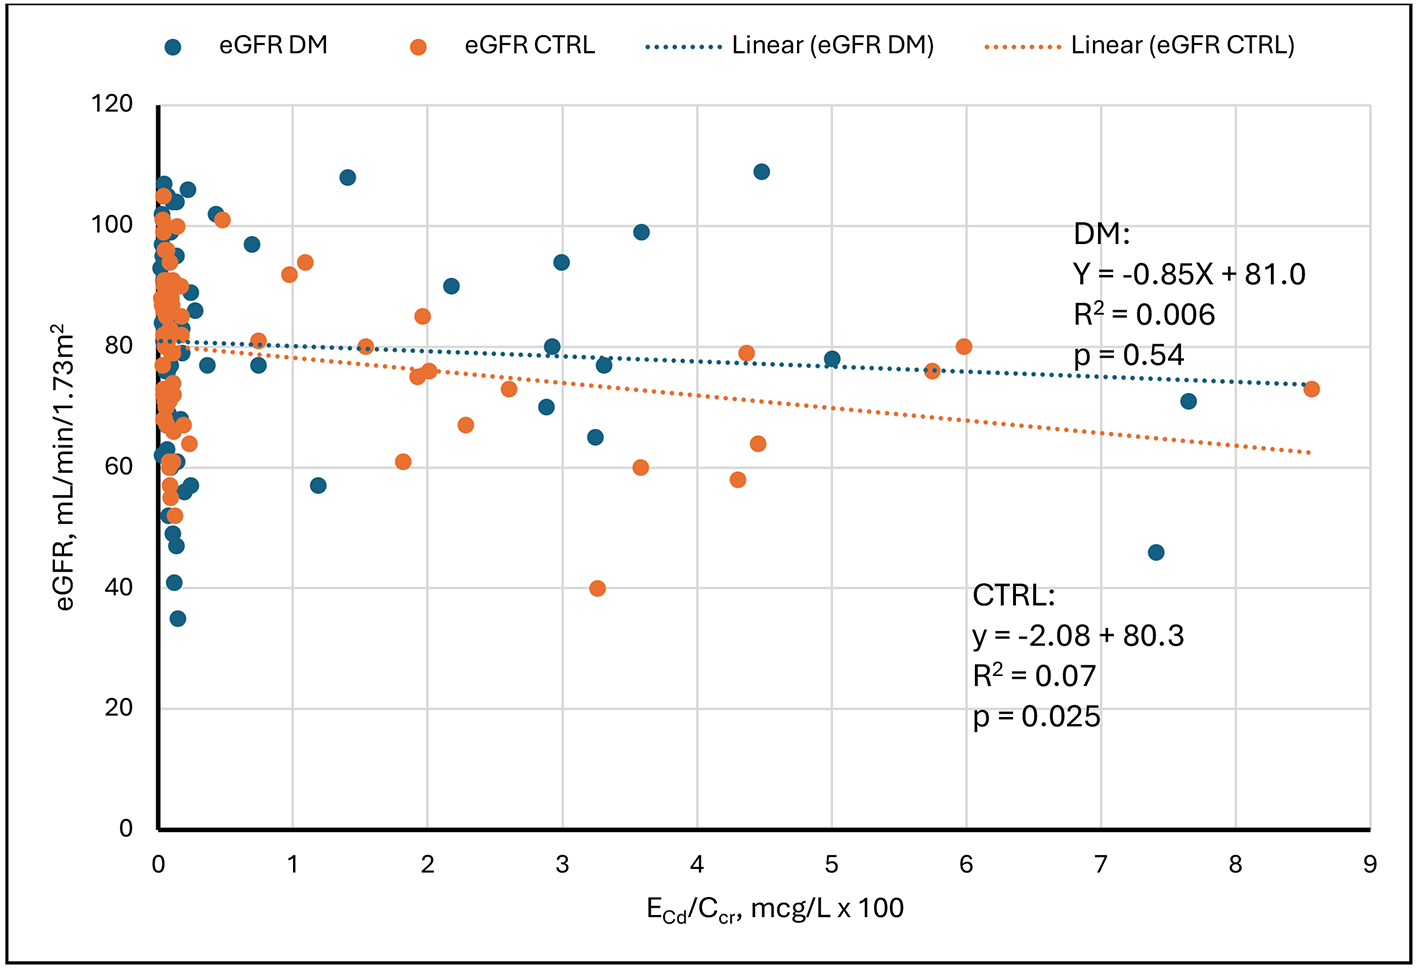
Figure 1. Linear regressions of eGFR on ECd/Ccr. Scatter diagrams present data from diabetics (DM, blue) and non-diabetic controls (CTRL, orange). An inverse relationship is evident in CTRL. No relationship is evident in DM. Cd: Cadmium; cr: creatinine; eGFR: estimated glomerular filtration rate; ECd/Ccr: amount of Cd excreted per volume of glomerular filtrate; DM: group with diabetes mellitus; CTRL: control group without diabetes.


