
fig3
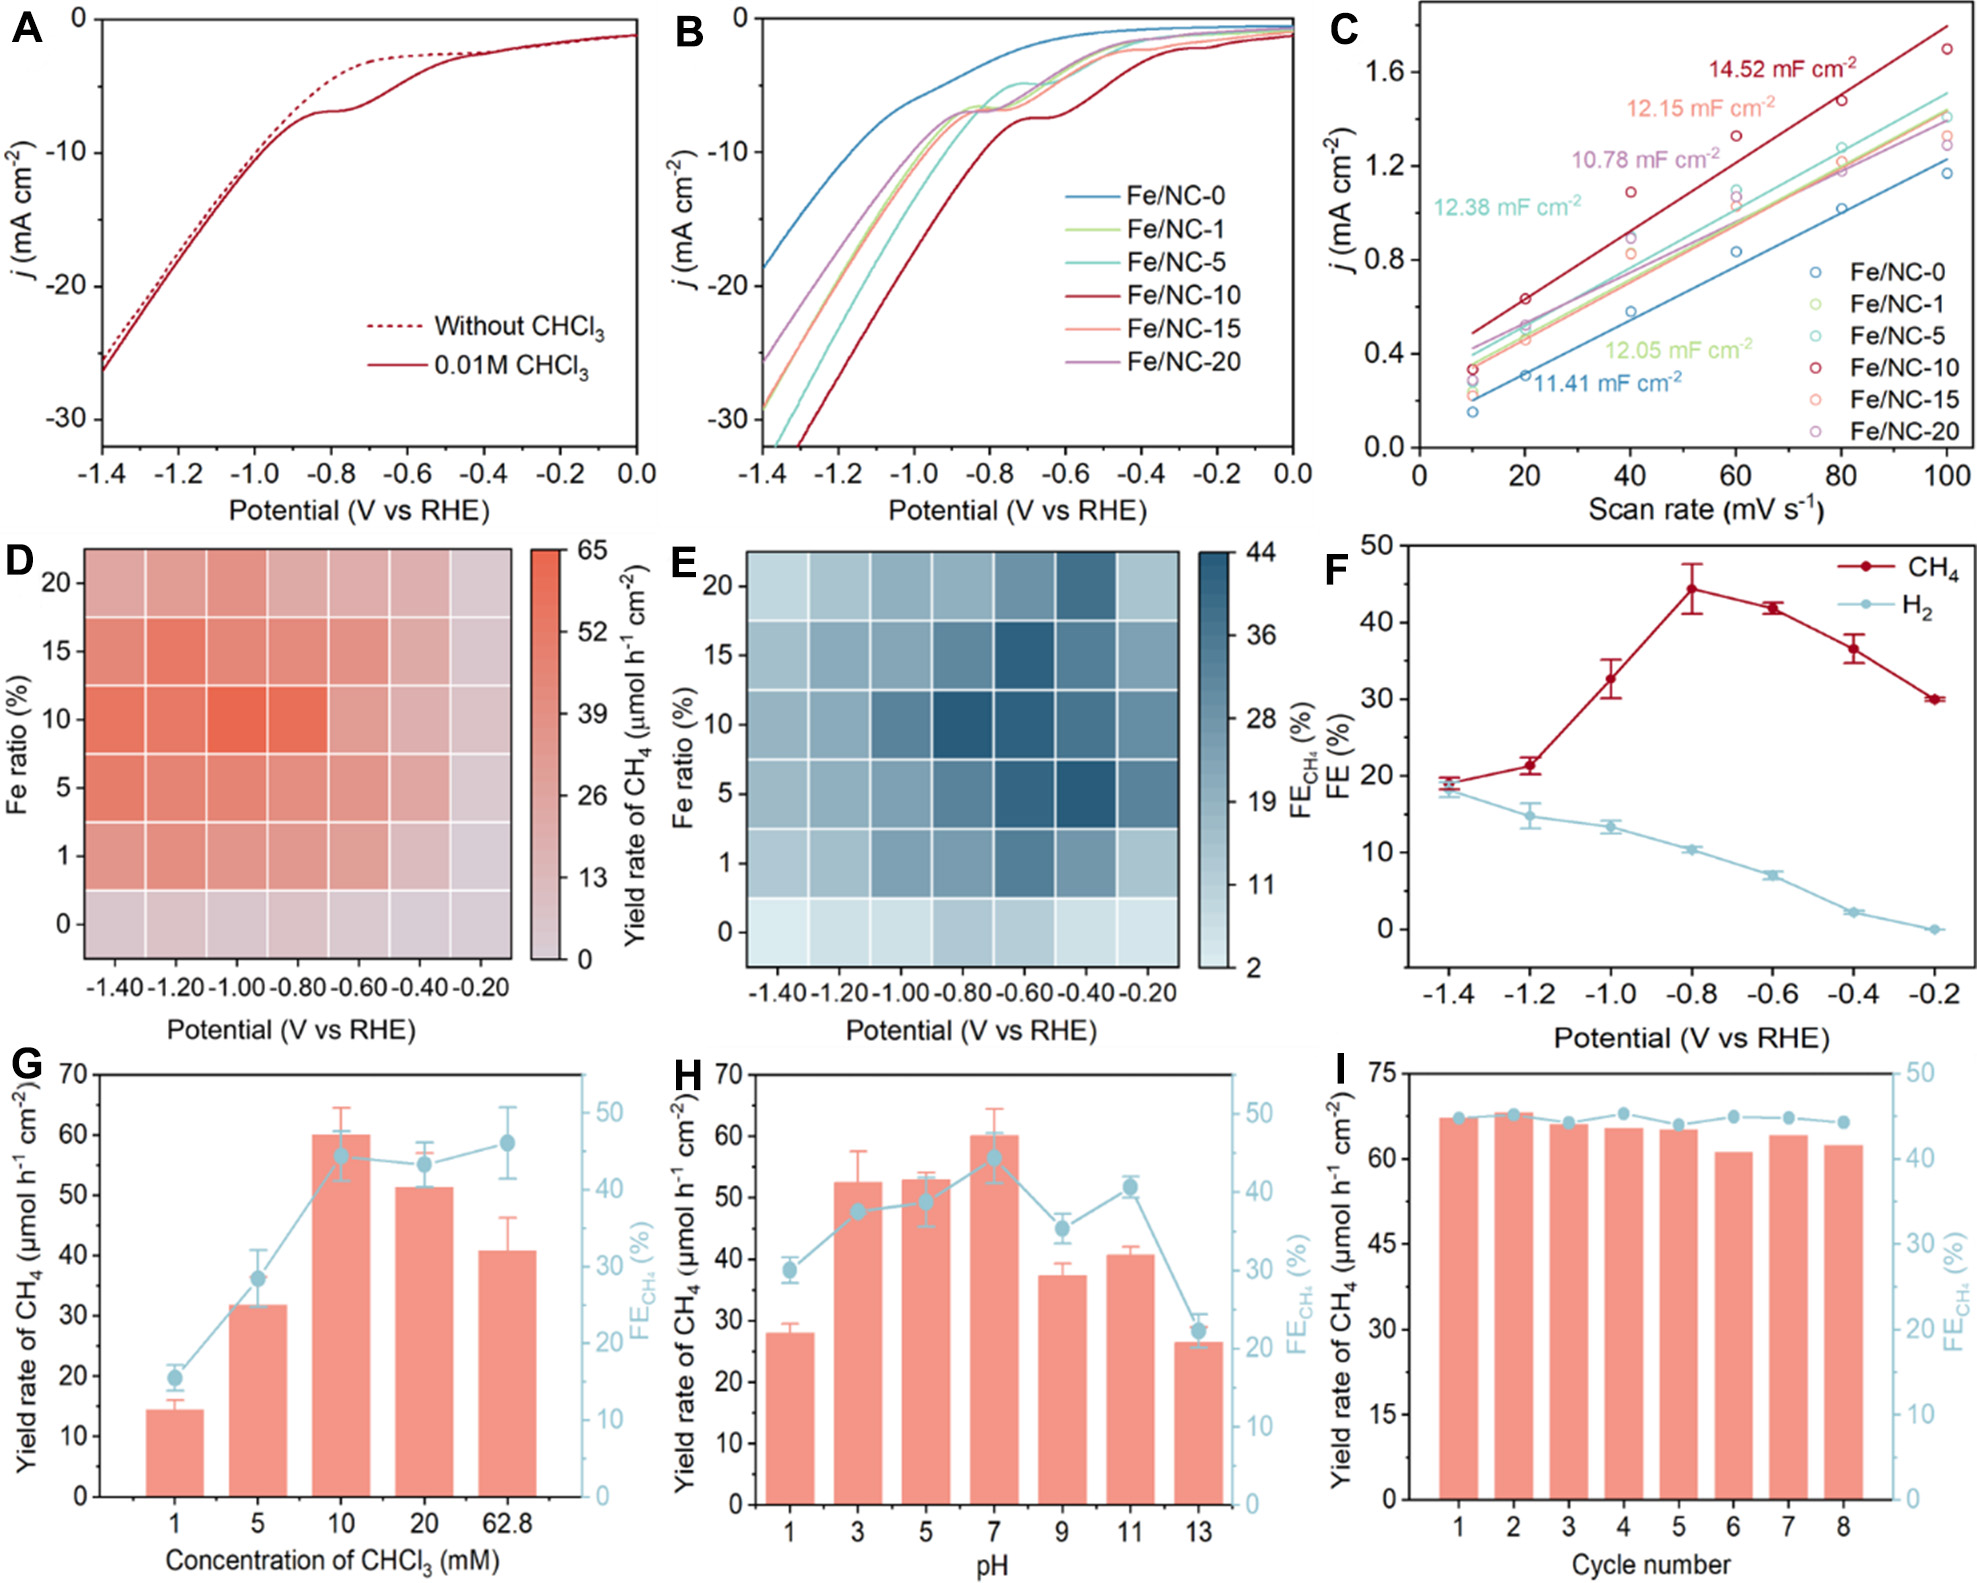
Figure 3. (A) LSV curves of Fe/NC-10 in the presence or absence of CHCl3; (B) LSV curves, (C) electrochemical active surface areas, heatmaps of (D) yield rate and (E) FE of Fe/NC catalysts with CHCl3; (F) FE of CH4 and H2 over Fe/NC-10. CH4 yield rate and FE of Fe/NC-10 at different (G) concentrations of CHCl3, (H) pH, and (I) cycling experiments. Error bars in (F-I) represent the standard deviation of three independent replicate experiments. Data plotting and fitting were performed using Origin 2022. LSV: Linear sweep voltammetry; FE: Faradaic efficiency; RHE: reversible hydrogen electrode.

