


fig7
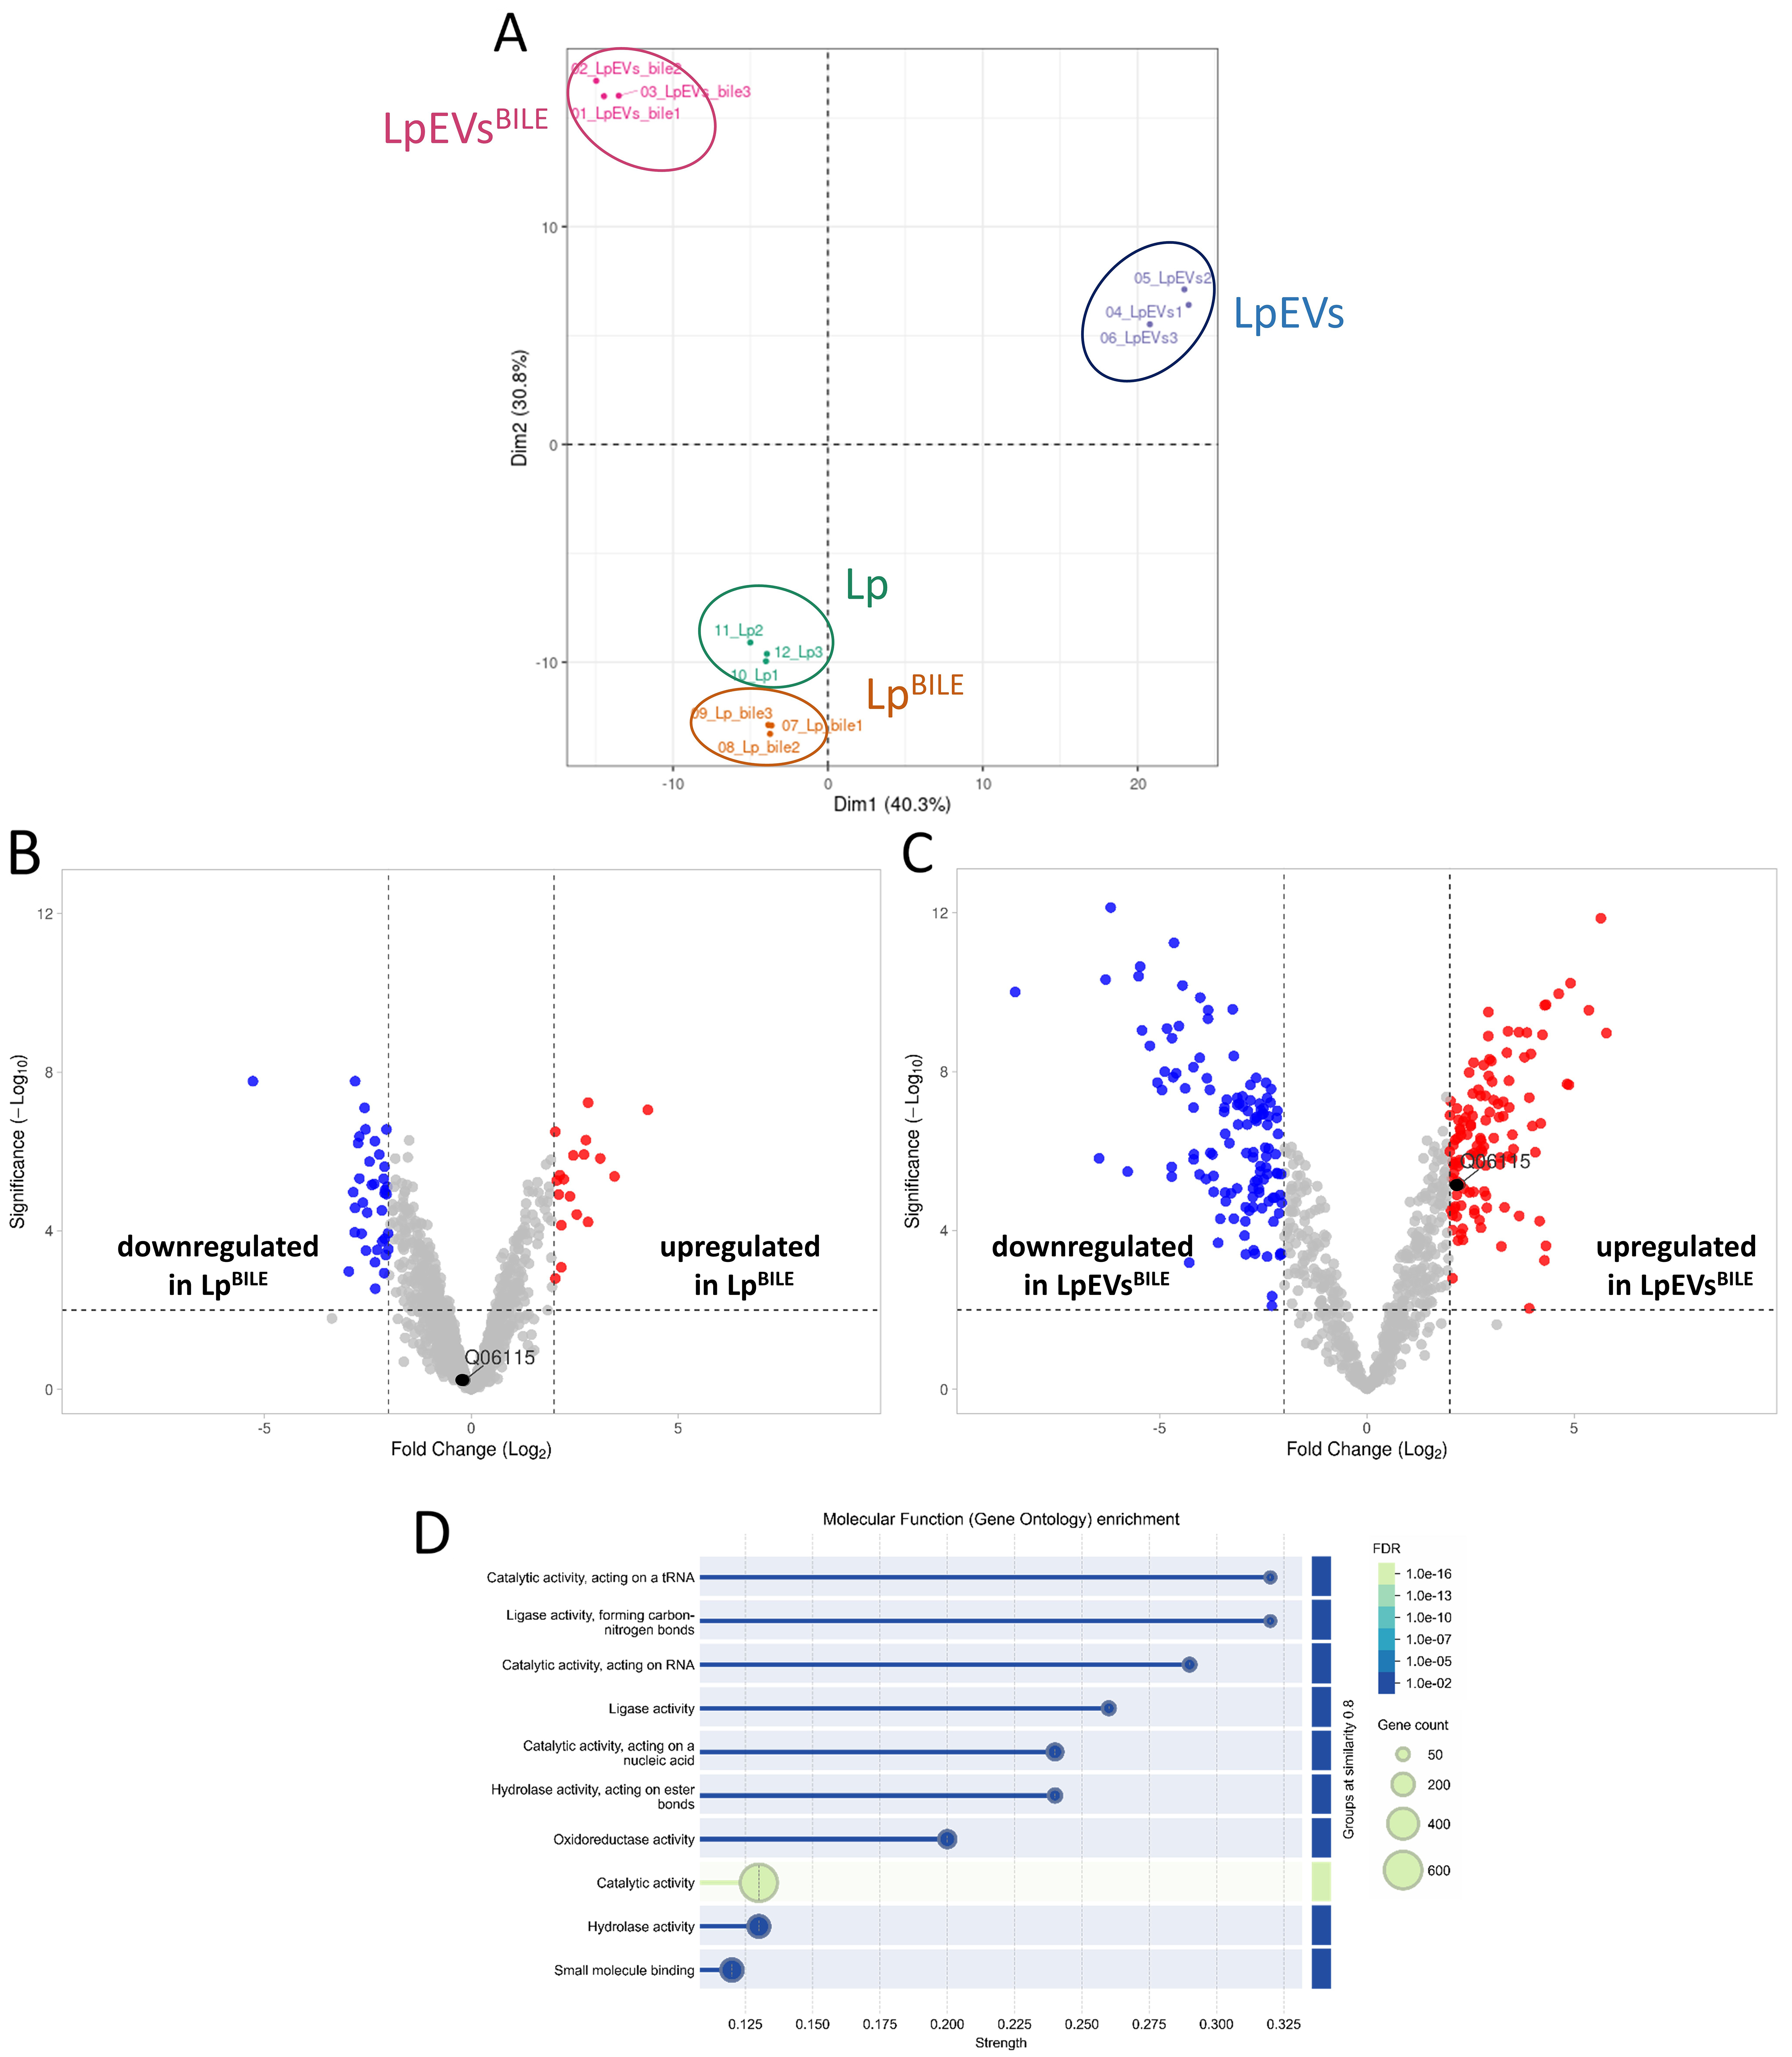
Figure 7. Proteomic analysis of L. plantarum, L. plantarumBILE, LpEVs, and LpEVsBILE. (A) PCA plot; (B) Volcano plot showing differential protein abundance between L. plantarum cultured without and with bile. BSH (Q06115) is highlighted with a black dot. Proteins with P ≤ 0.05 and a fold change ≥ 2 were considered significantly altered; (C) Volcano plot showing differences in the protein profiles of LpEVsBILE compared with LpEVs. Proteins with P ≤ 0.05 and a fold change ≥ 2 were considered significantly altered. BSH is highlighted with a black dot; (D) Gene Ontology enrichment analysis of molecular functions in LpEVsBILE compared with the L. plantarum reference proteome, performed using STRING. Enriched terms with adjusted P ≤ 0.05 (FDR) were considered statistically significant. L. plantarum: Lactiplantibacillus plantarum; LpEVs: L. plantarum EVs; PCA: principal component analysis; BSH: bile salt hydrolase; FDR: false discovery rate.




