


fig2
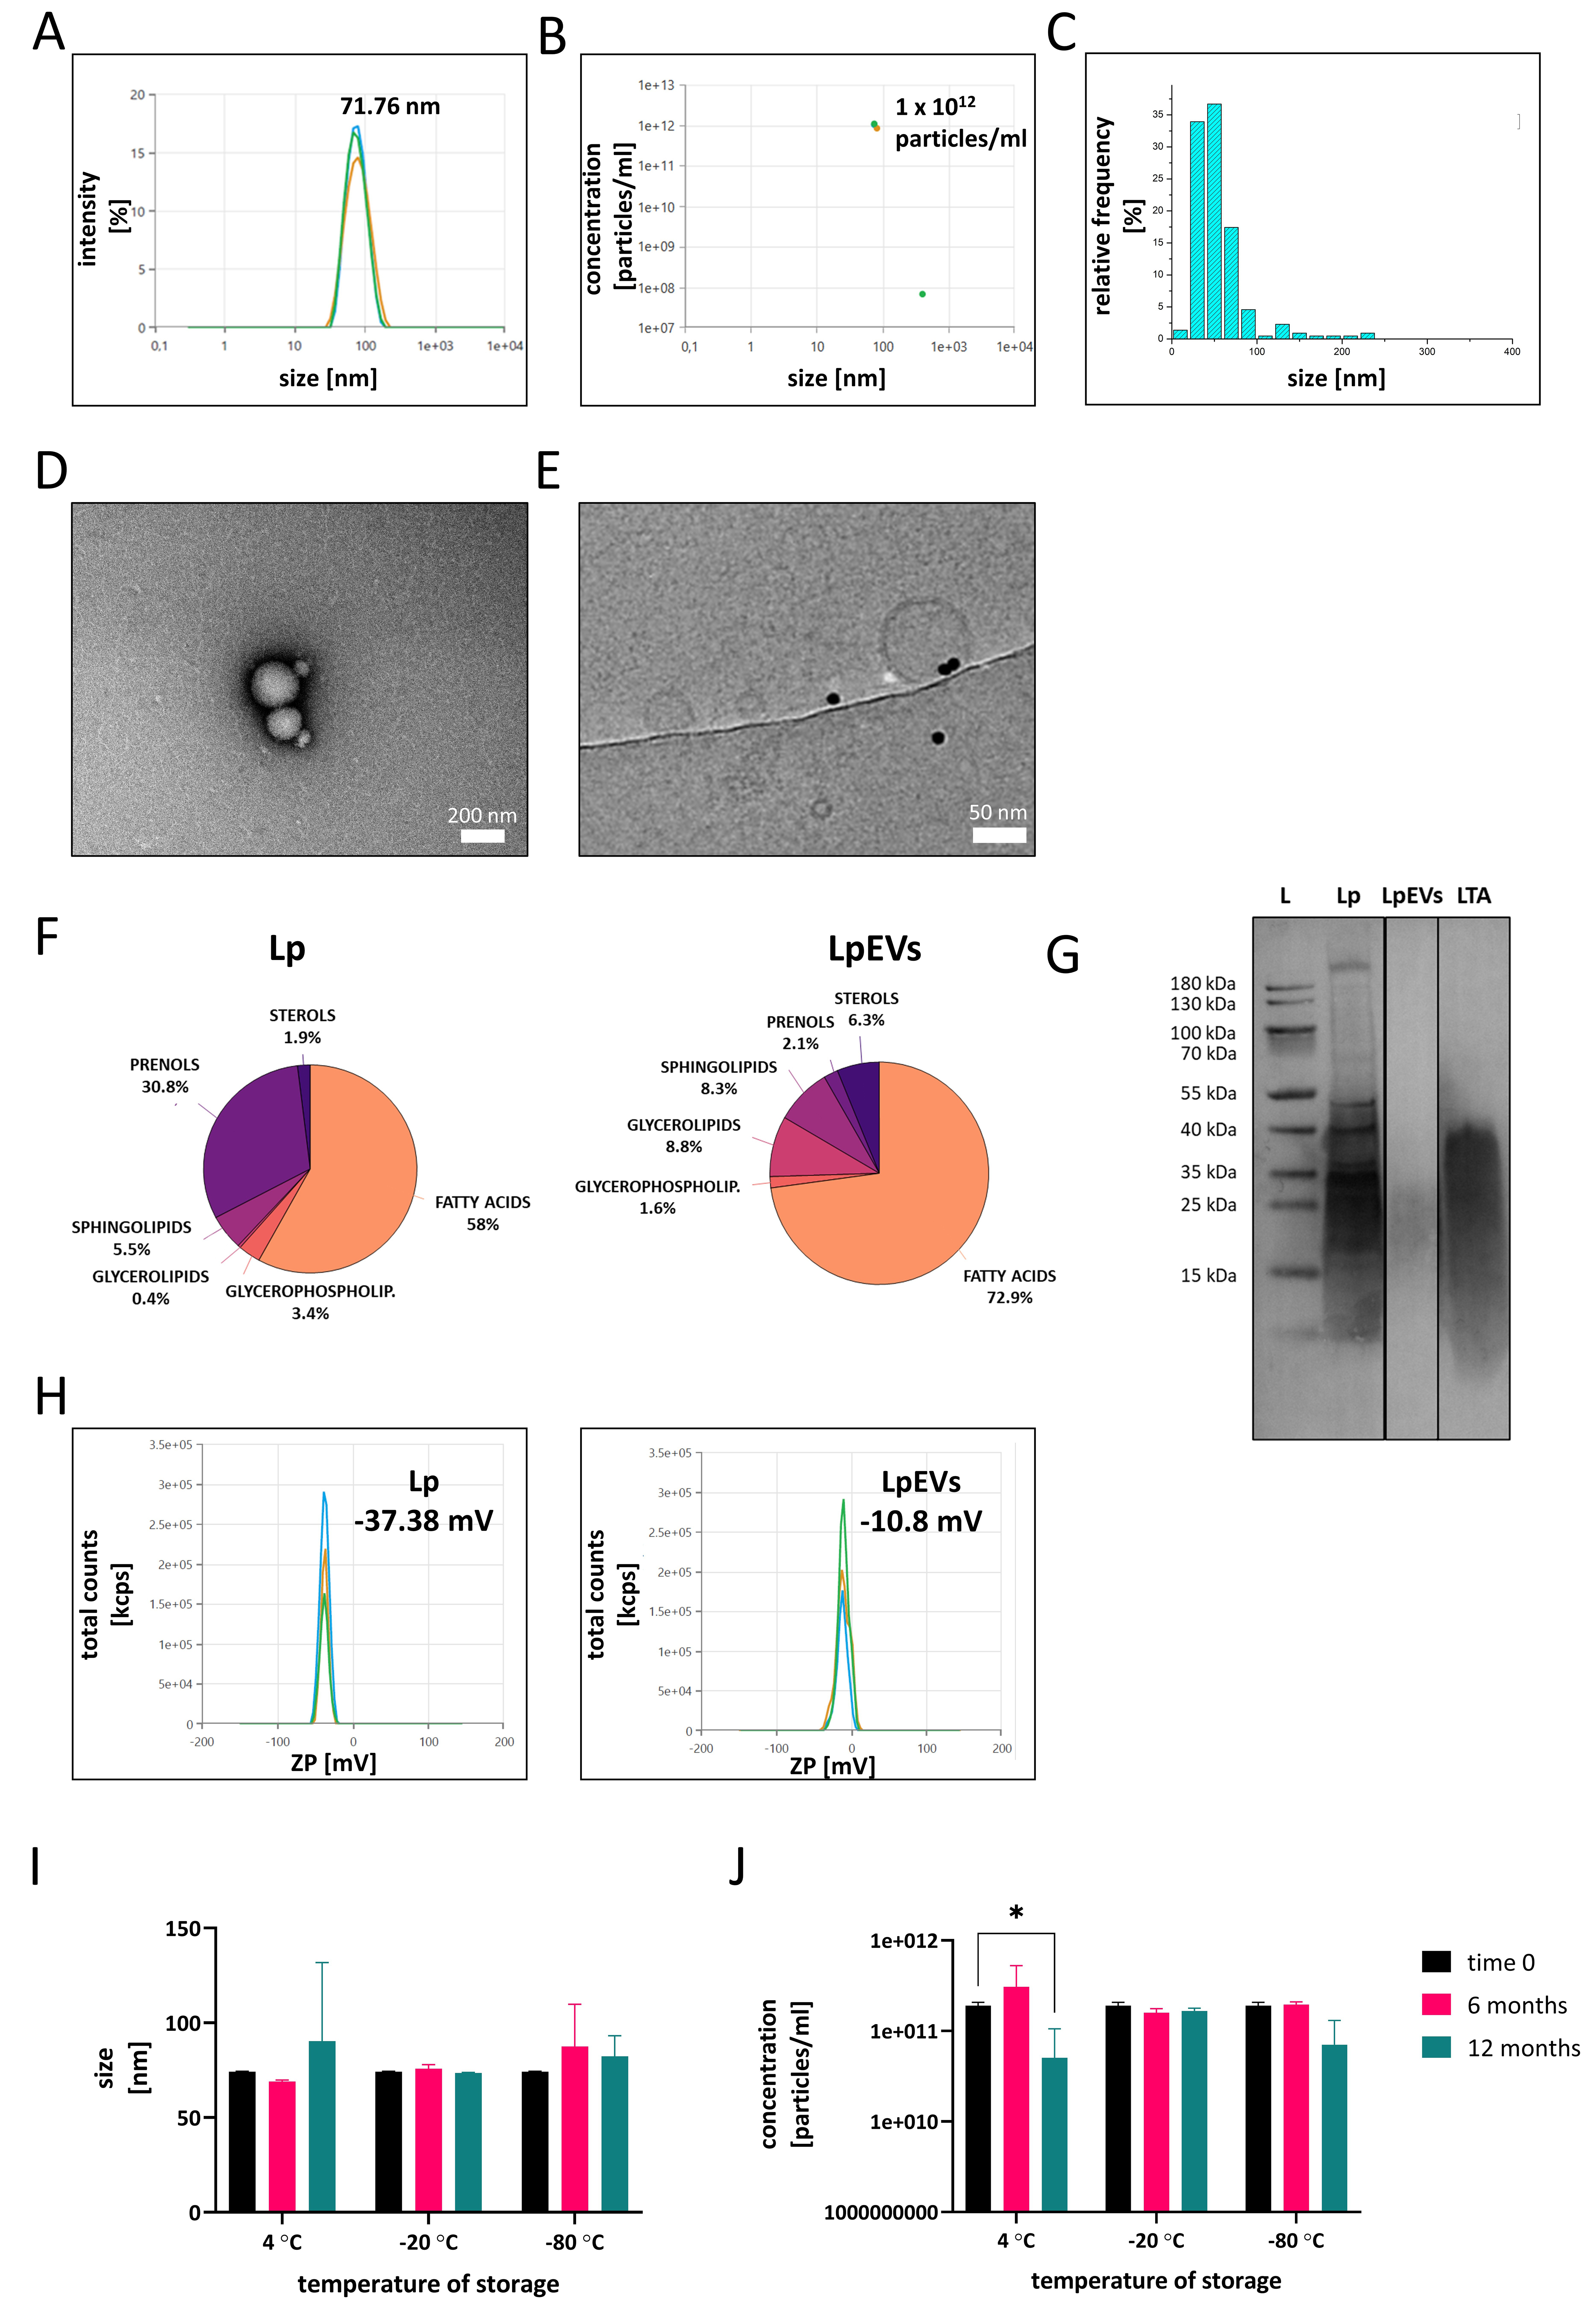
Figure 2. Characterization of LpEVs. (A) Representative measurements of particle size and concentration (B) of LpEVs obtained using a Zetasizer; (C) Size distribution of LpEVs determined using cryo-EM; (D) TEM and (E) cryo-EM visualization of LpEVs; (F) Surface lipid composition of intact L. plantarum and LpEVs analyzed via ToF-SIMS; (G) Western blot analysis of LTA in L. plantarum lysates and LpEVs (L, protein ladder; 10 µg of L. plantarum lysate, 1.5 × 10¹⁰ LpEVs, and 10 µg of commercial LTA were loaded per lane); (H) ZP measurements of L. plantarum and LpEVs in 1 mM HEPES buffer; Long-term stability of LpEVs stored in 25 mM HEPES-N buffer at 4, -20, and -80 °C showing changes in particle size (I) and concentration (J) over time. Data were analyzed using two-way ANOVA followed by Dunnett’s multiple-comparisons test. Significant differences are indicated as *P ≤ 0.05. LpEVs: L. plantarum EVs; cryo-EM: cryogenic electron microscopy; TEM: transmission electron microscopy; L. plantarum: Lactiplantibacillus plantarum; ToF-SIMS: time-of-flight secondary ion mass spectrometry; LTA: lipoteichoic acid; ZP: zeta potential; HEPES: 4-(2-Hydroxyethyl)piperazine-1-ethanesulfonic acid sodium salt; HEPES-N: HEPES with 0.9% NaCl; ANOVA: analysis of variance.




