





fig5
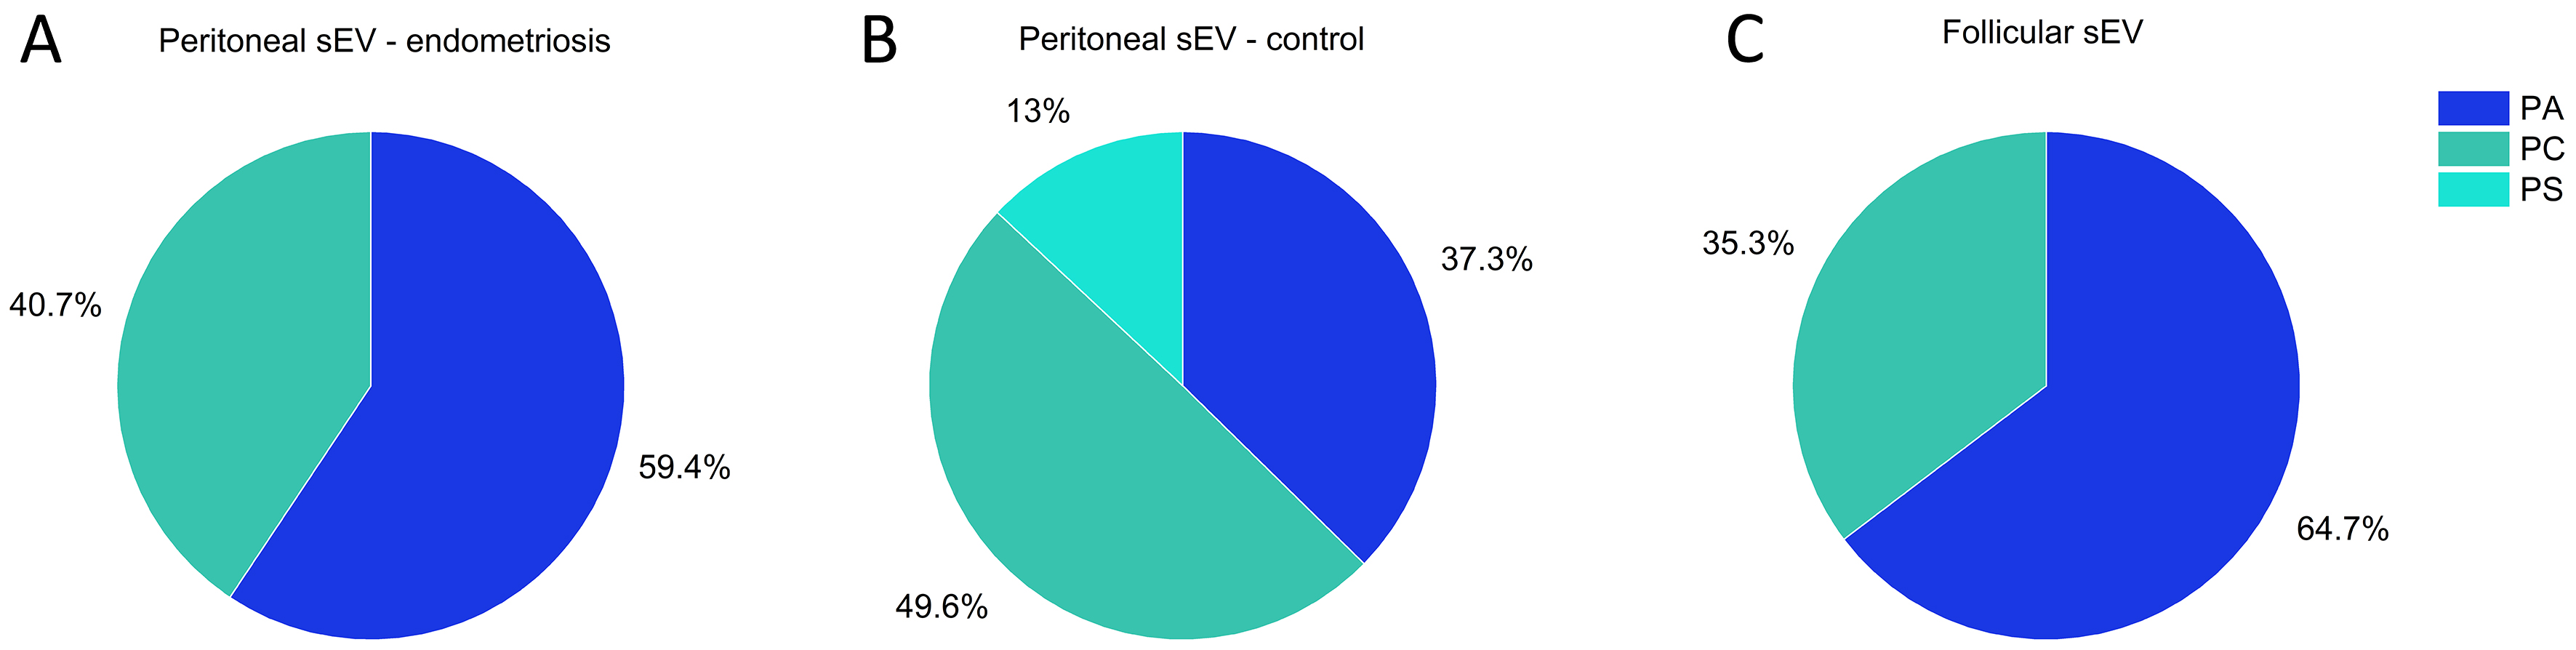
Figure 5. CLS fitting results obtained by fitting the average Raman spectra of sEVs using the reference spectra of PC, PA, and PS as basis components, with normalized scores expressed as fractional contributions to the total lipid signal. Panels show results for (A) Peritoneal fluid, control subjects (without endometriosis); (B) Peritoneal fluid, women with endometriosis; and (C) Follicular fluid, control subjects. CLS: Classical least squares; PA: phosphatidic acid; PC: phosphatidylcholine; PS: phosphatidylserine; sEVs: small extracellular vesicles.




