





fig4
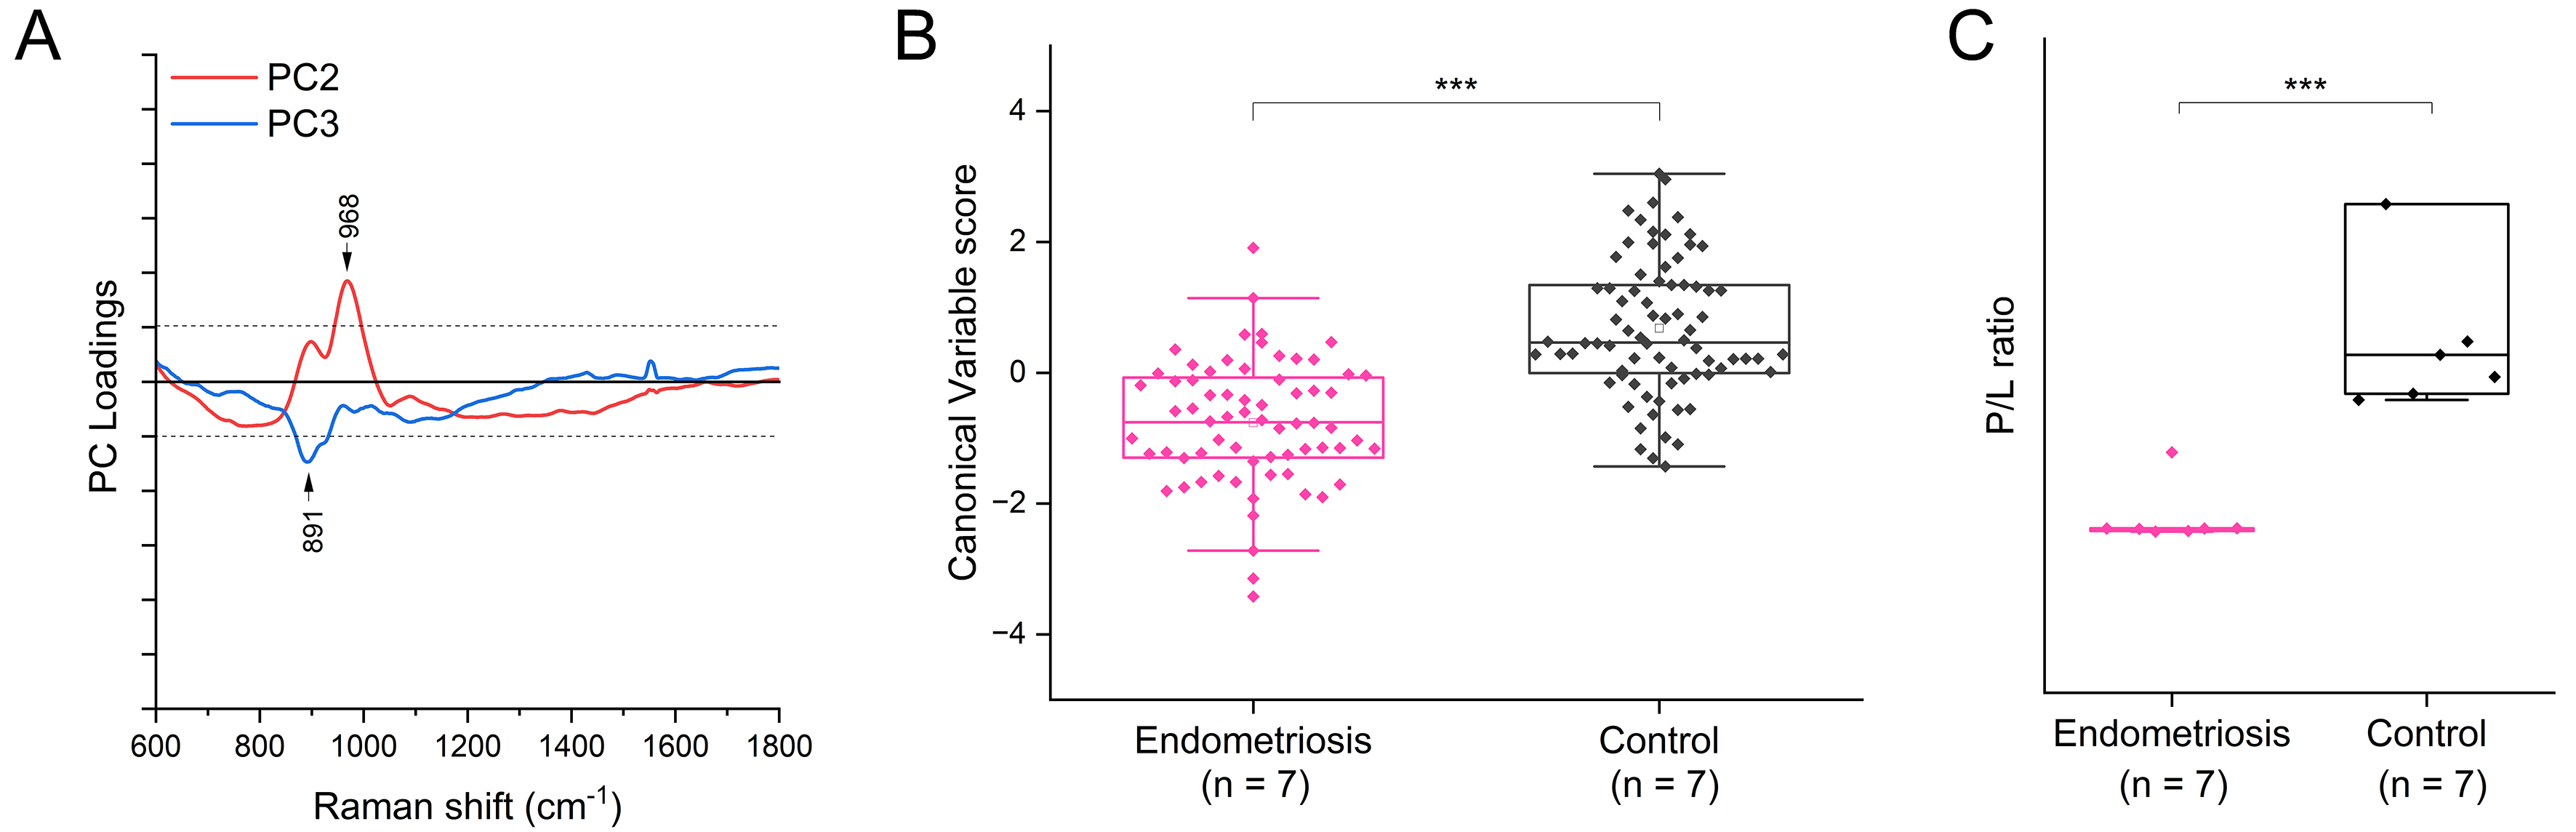
Figure 4. (A) Loadings of PC 2 and 3 obtained after PCA applied to all the spectra from peritoneal sEVs of controls and women with endometriosis. Arrows highlight those peaks that change most, with absolute loading values > 0.05, between the considered groups; (B) Box plot of the canonical variable scores obtained after the PCA-LDA of the considered samples. Each dot represents one single spectrum of peritoneal sEVs, not a single patient. ***P < 0.001 after non-parametric Mann-Whitney test applied to canonical variable scores obtained at the spectrum level; note that this analysis was performed at the spectrum level to assess spectral consistency, and statistical significance should be interpreted with caution given the non-independence of multiple spectra per patient; and (C) Spectral P/L ratio calculated on the average spectra of peritoneal sEVs. Each dot represents one patient. ***P < 0.001 after non-parametric Mann-Whitney test. P/L: Protein-to-lipid; PC: principal component; PCA: principal component analysis; PCA-LDA: principal component analysis-linear discriminant analysis; sEVs: small extracellular vesicles.




