


fig2
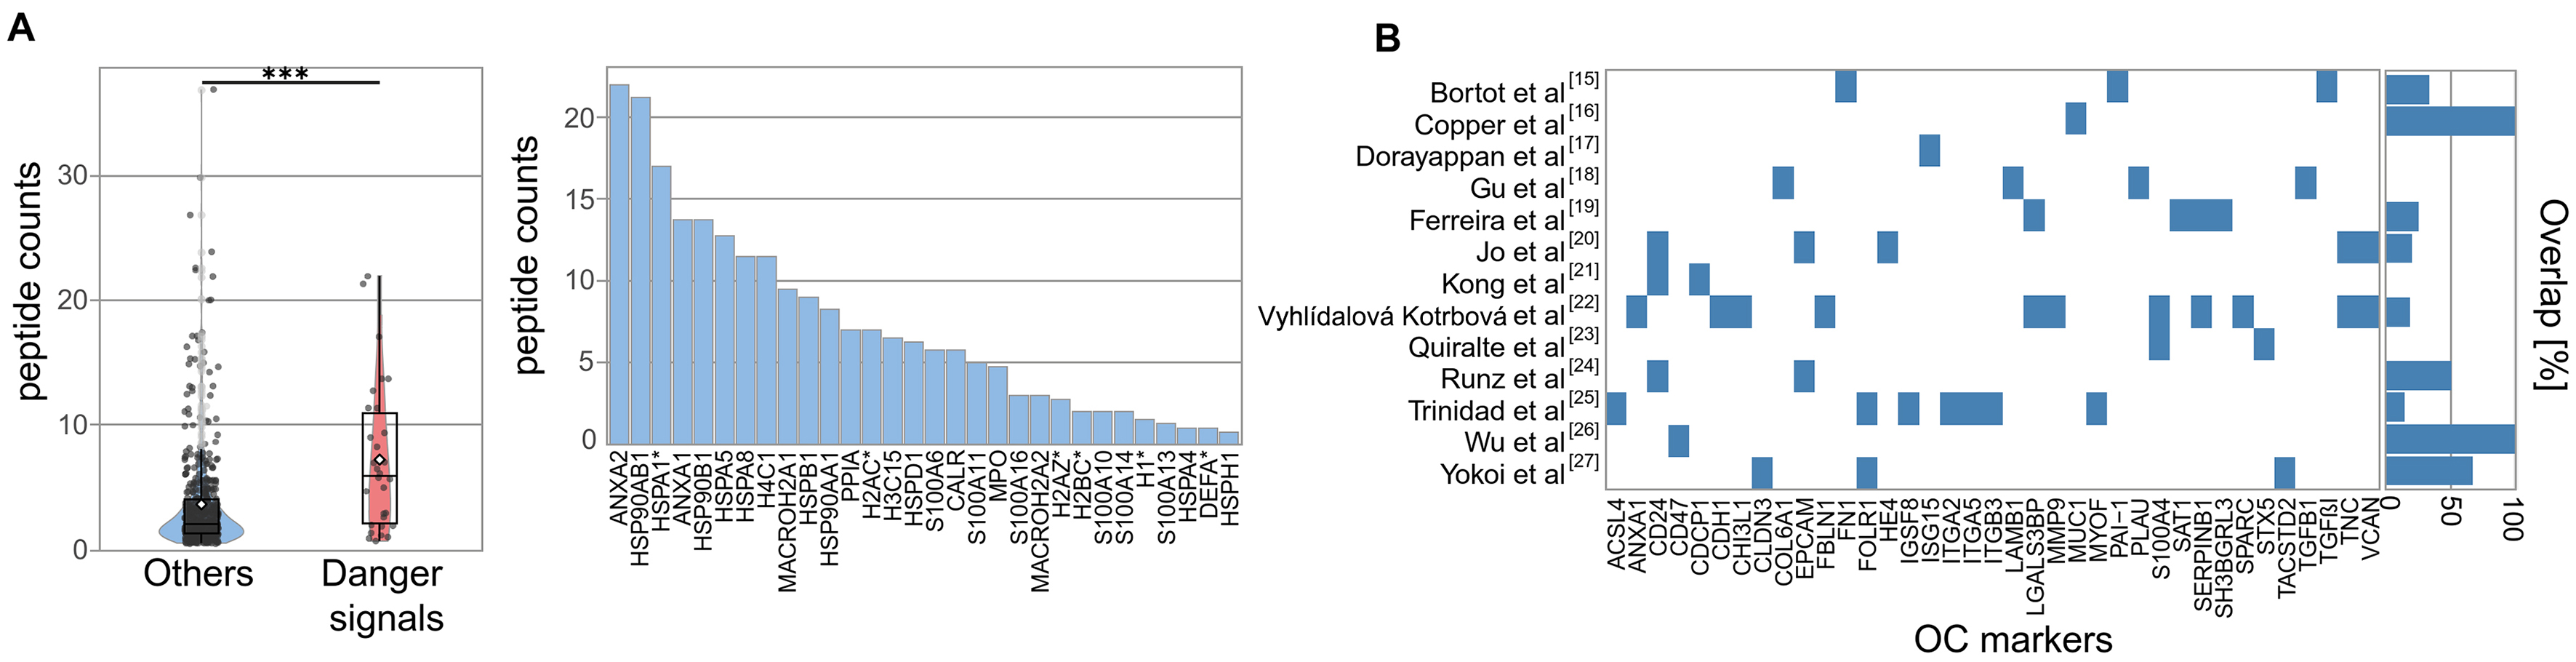
Figure 2. Enrichment of Danger Signals in EVs. (A) Box-and-whisker plot comparing the peptide counts of danger molecules vs. other proteins. Boxes = interquartile range; line = median; white dot = mean; whiskers = 1.5 × IQR; light dots = outliers. Statistical significance is indicated as ***P < 0.001, calculated using two-sided Wilcoxon rank-sum tests; (B) Overlap of HGSOC EV markers from published studies with the current dataset, shown as percentage per study. EVs: Extracellular vesicles; HGSOC: high-grade serous ovarian cancer; IQR: interquartile range.


