fig3
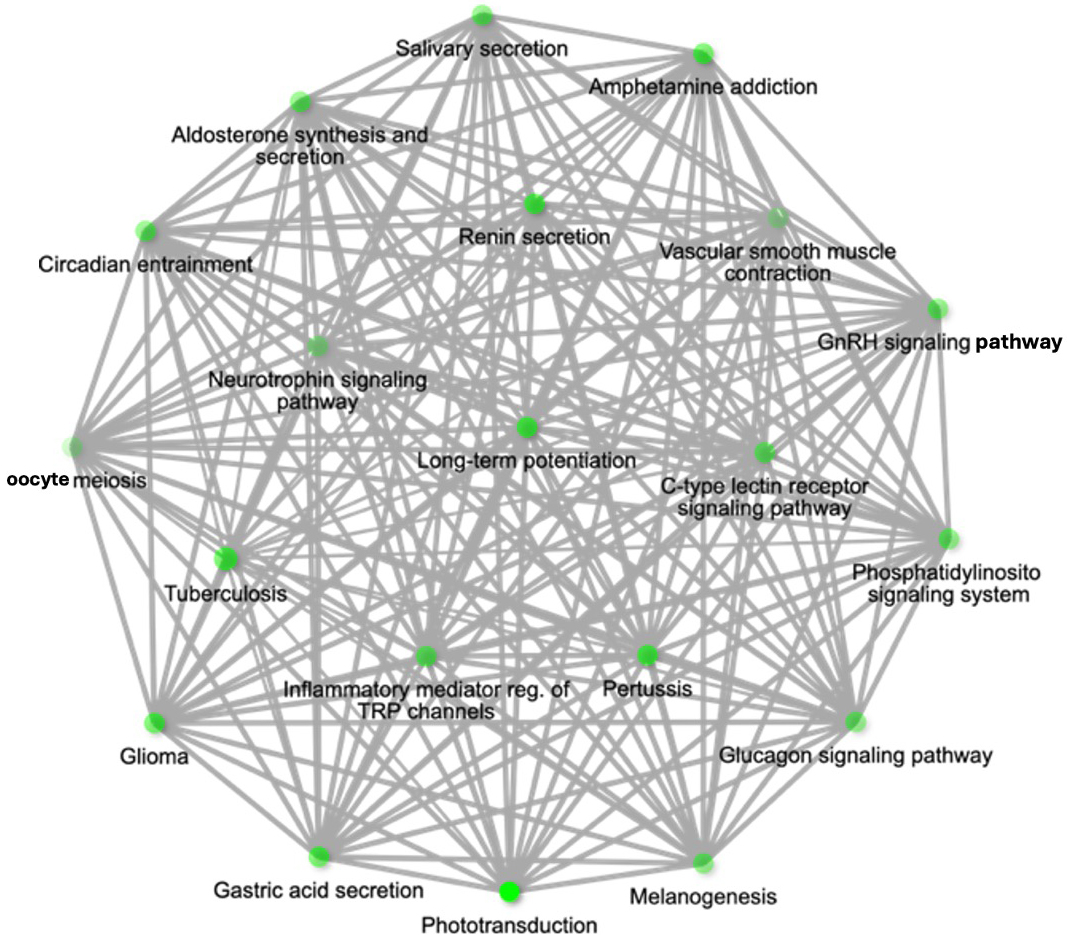
Figure 3. Pathway network for upregulated miR-4645-3p and associated pathways of hsa-miR-4645-3p represented as a hierarchical clustering tree. Pathway network diagram showing the target genes of hsa-miR-4645-3p within threshold with 3 prediction tools. The network highlights the relationship between enriched pathways, where 2 nodes (pathways) are connected if they share 20% or more genes. Darker nodes represent more significantly enriched gene sets, while larger nodes indicate larger gene sets. Thicker edges between nodes denote greater overlap of genes between pathways. The pathways are enriched based on the target genes of miR-4645-3p.