


fig3
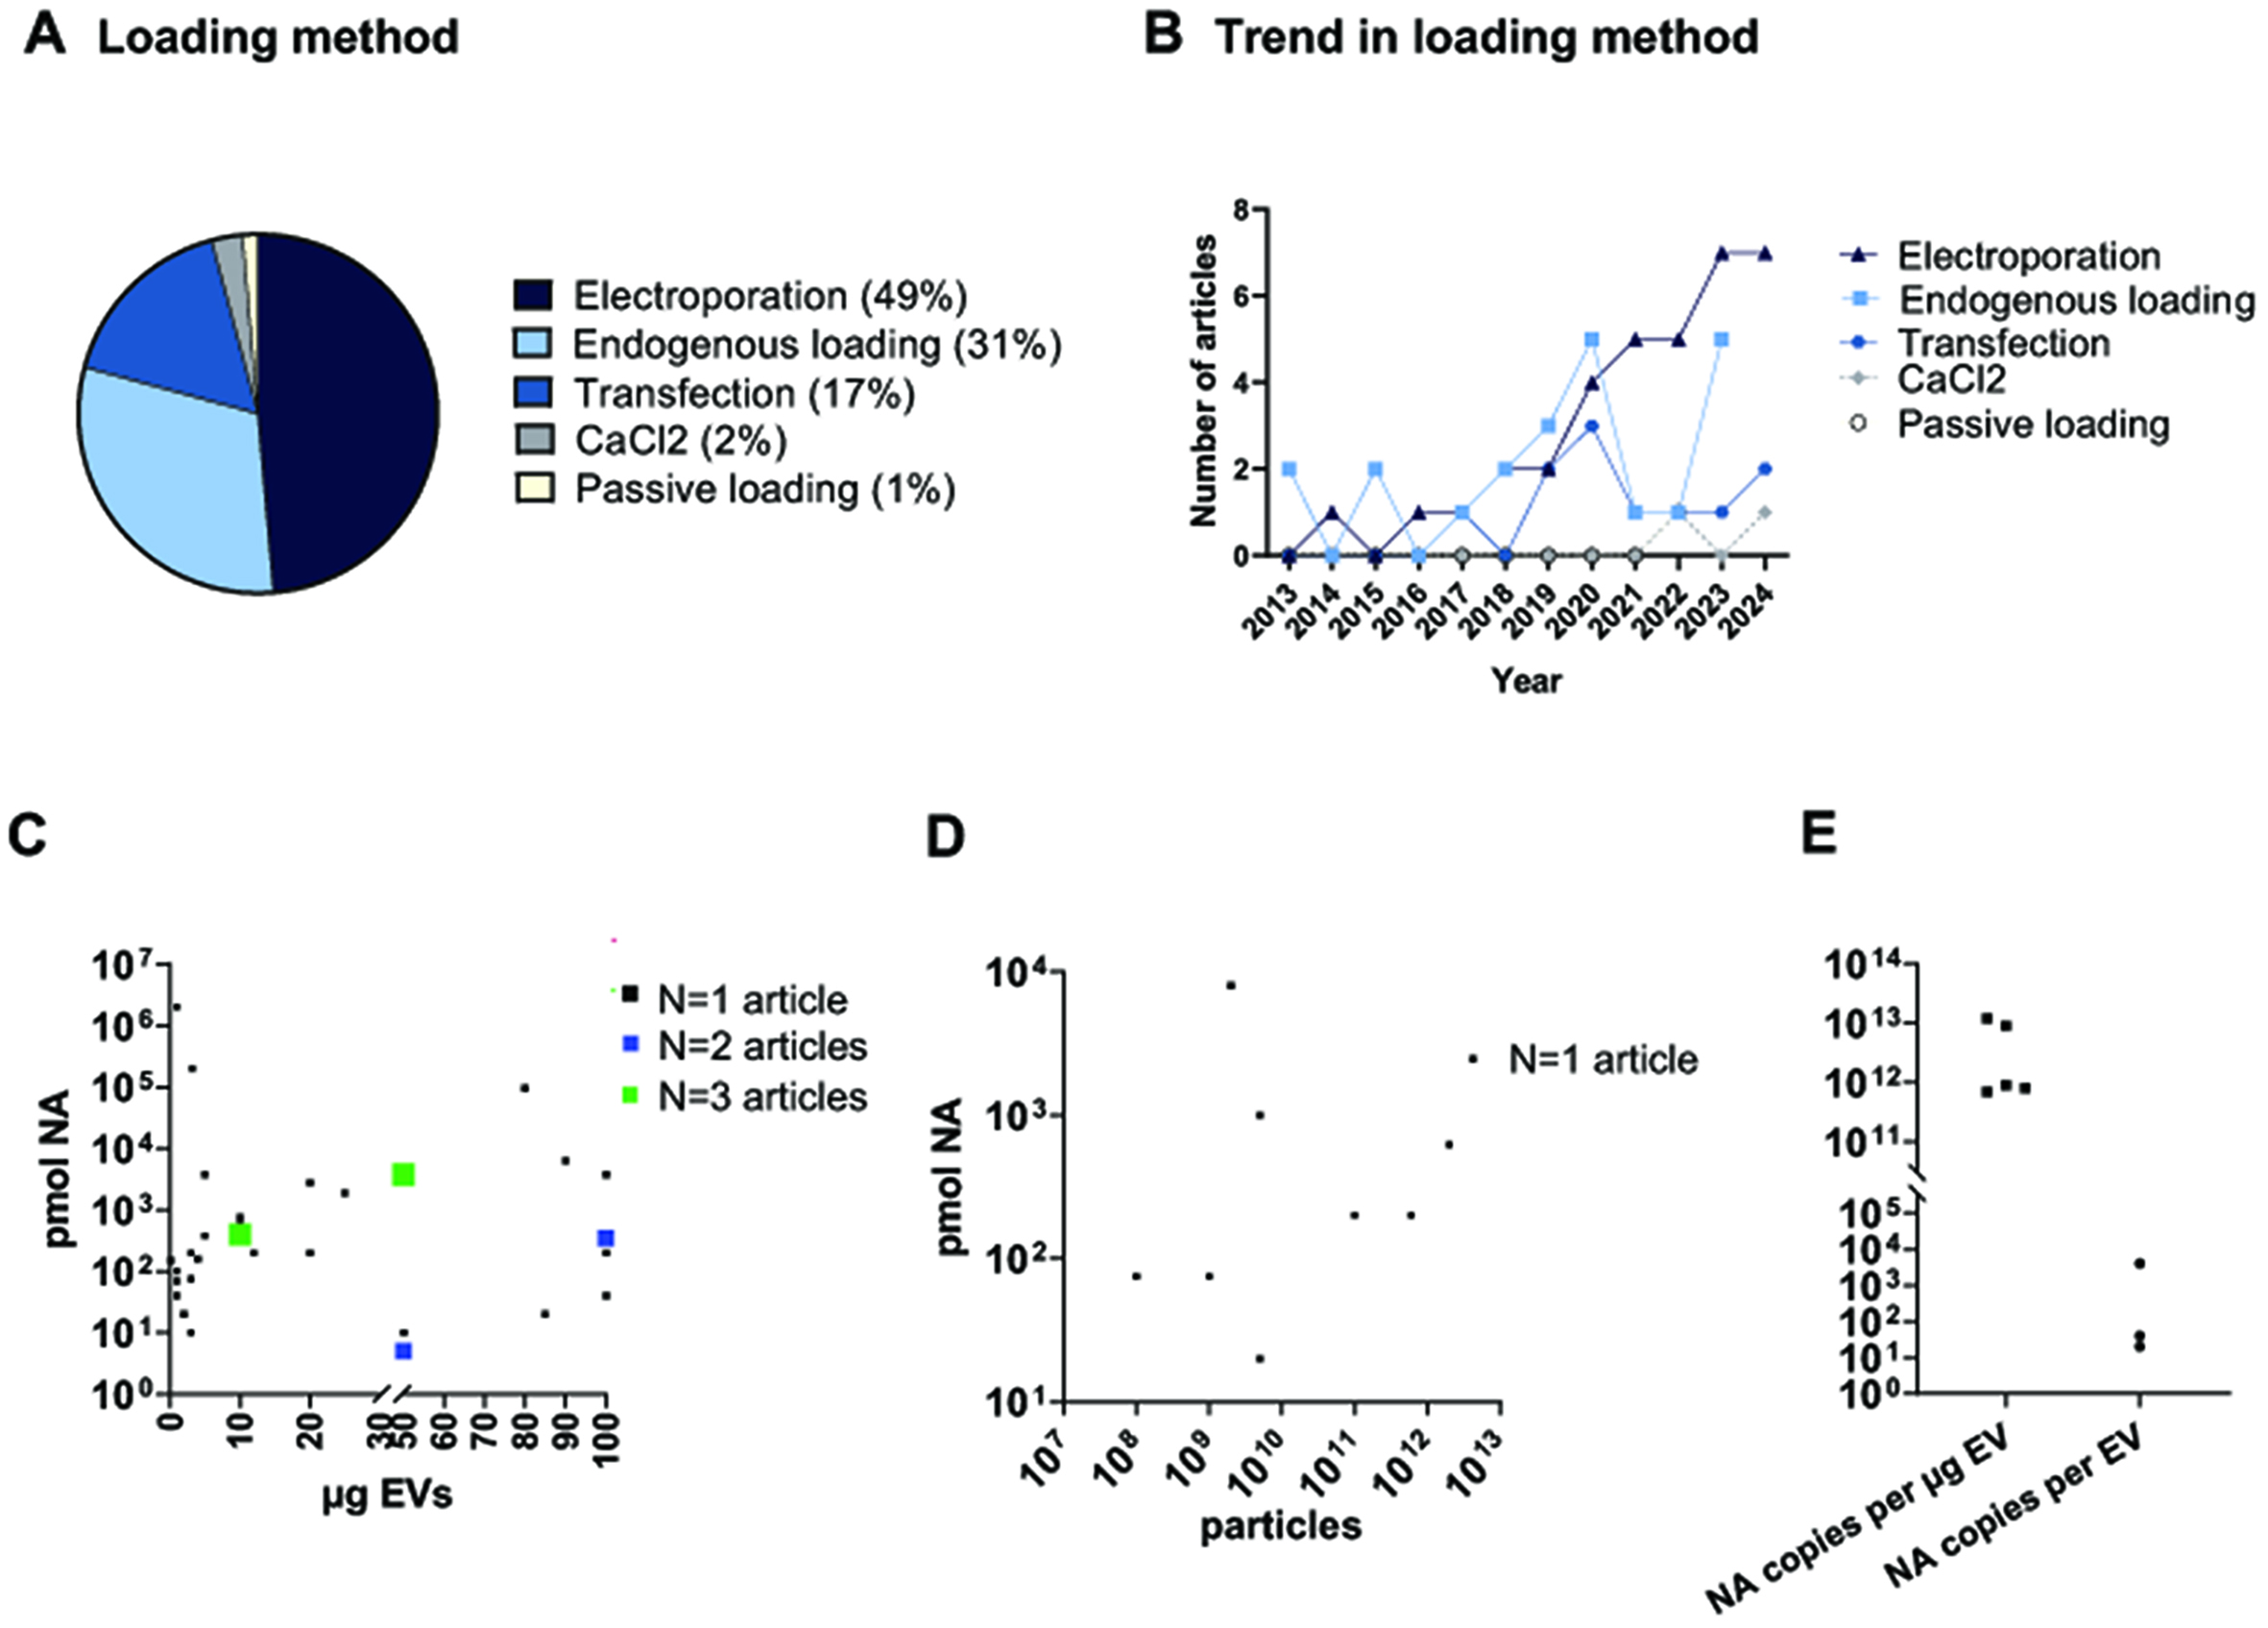
Figure 3. EV loading with snc RNA. (A) Pie chart illustrating the percentage of each loading method used across studies; (B) Graphical representation of the loading methods trend across years; (C and D) Graphs reporting the loading scheme based on pmol of loaded nucleic acid (NA) versus EVs µg (C) or EV number (D), for each analyzed article; (E) Graphical representation of the absolute quantification of cargo loading based on the number of copies of loaded NA per µg of EV or EV number (E). EV: Extracellular vesicle; sncRNAs: small non-coding RNAs; EVs: extracellular vesicles.


