


fig5
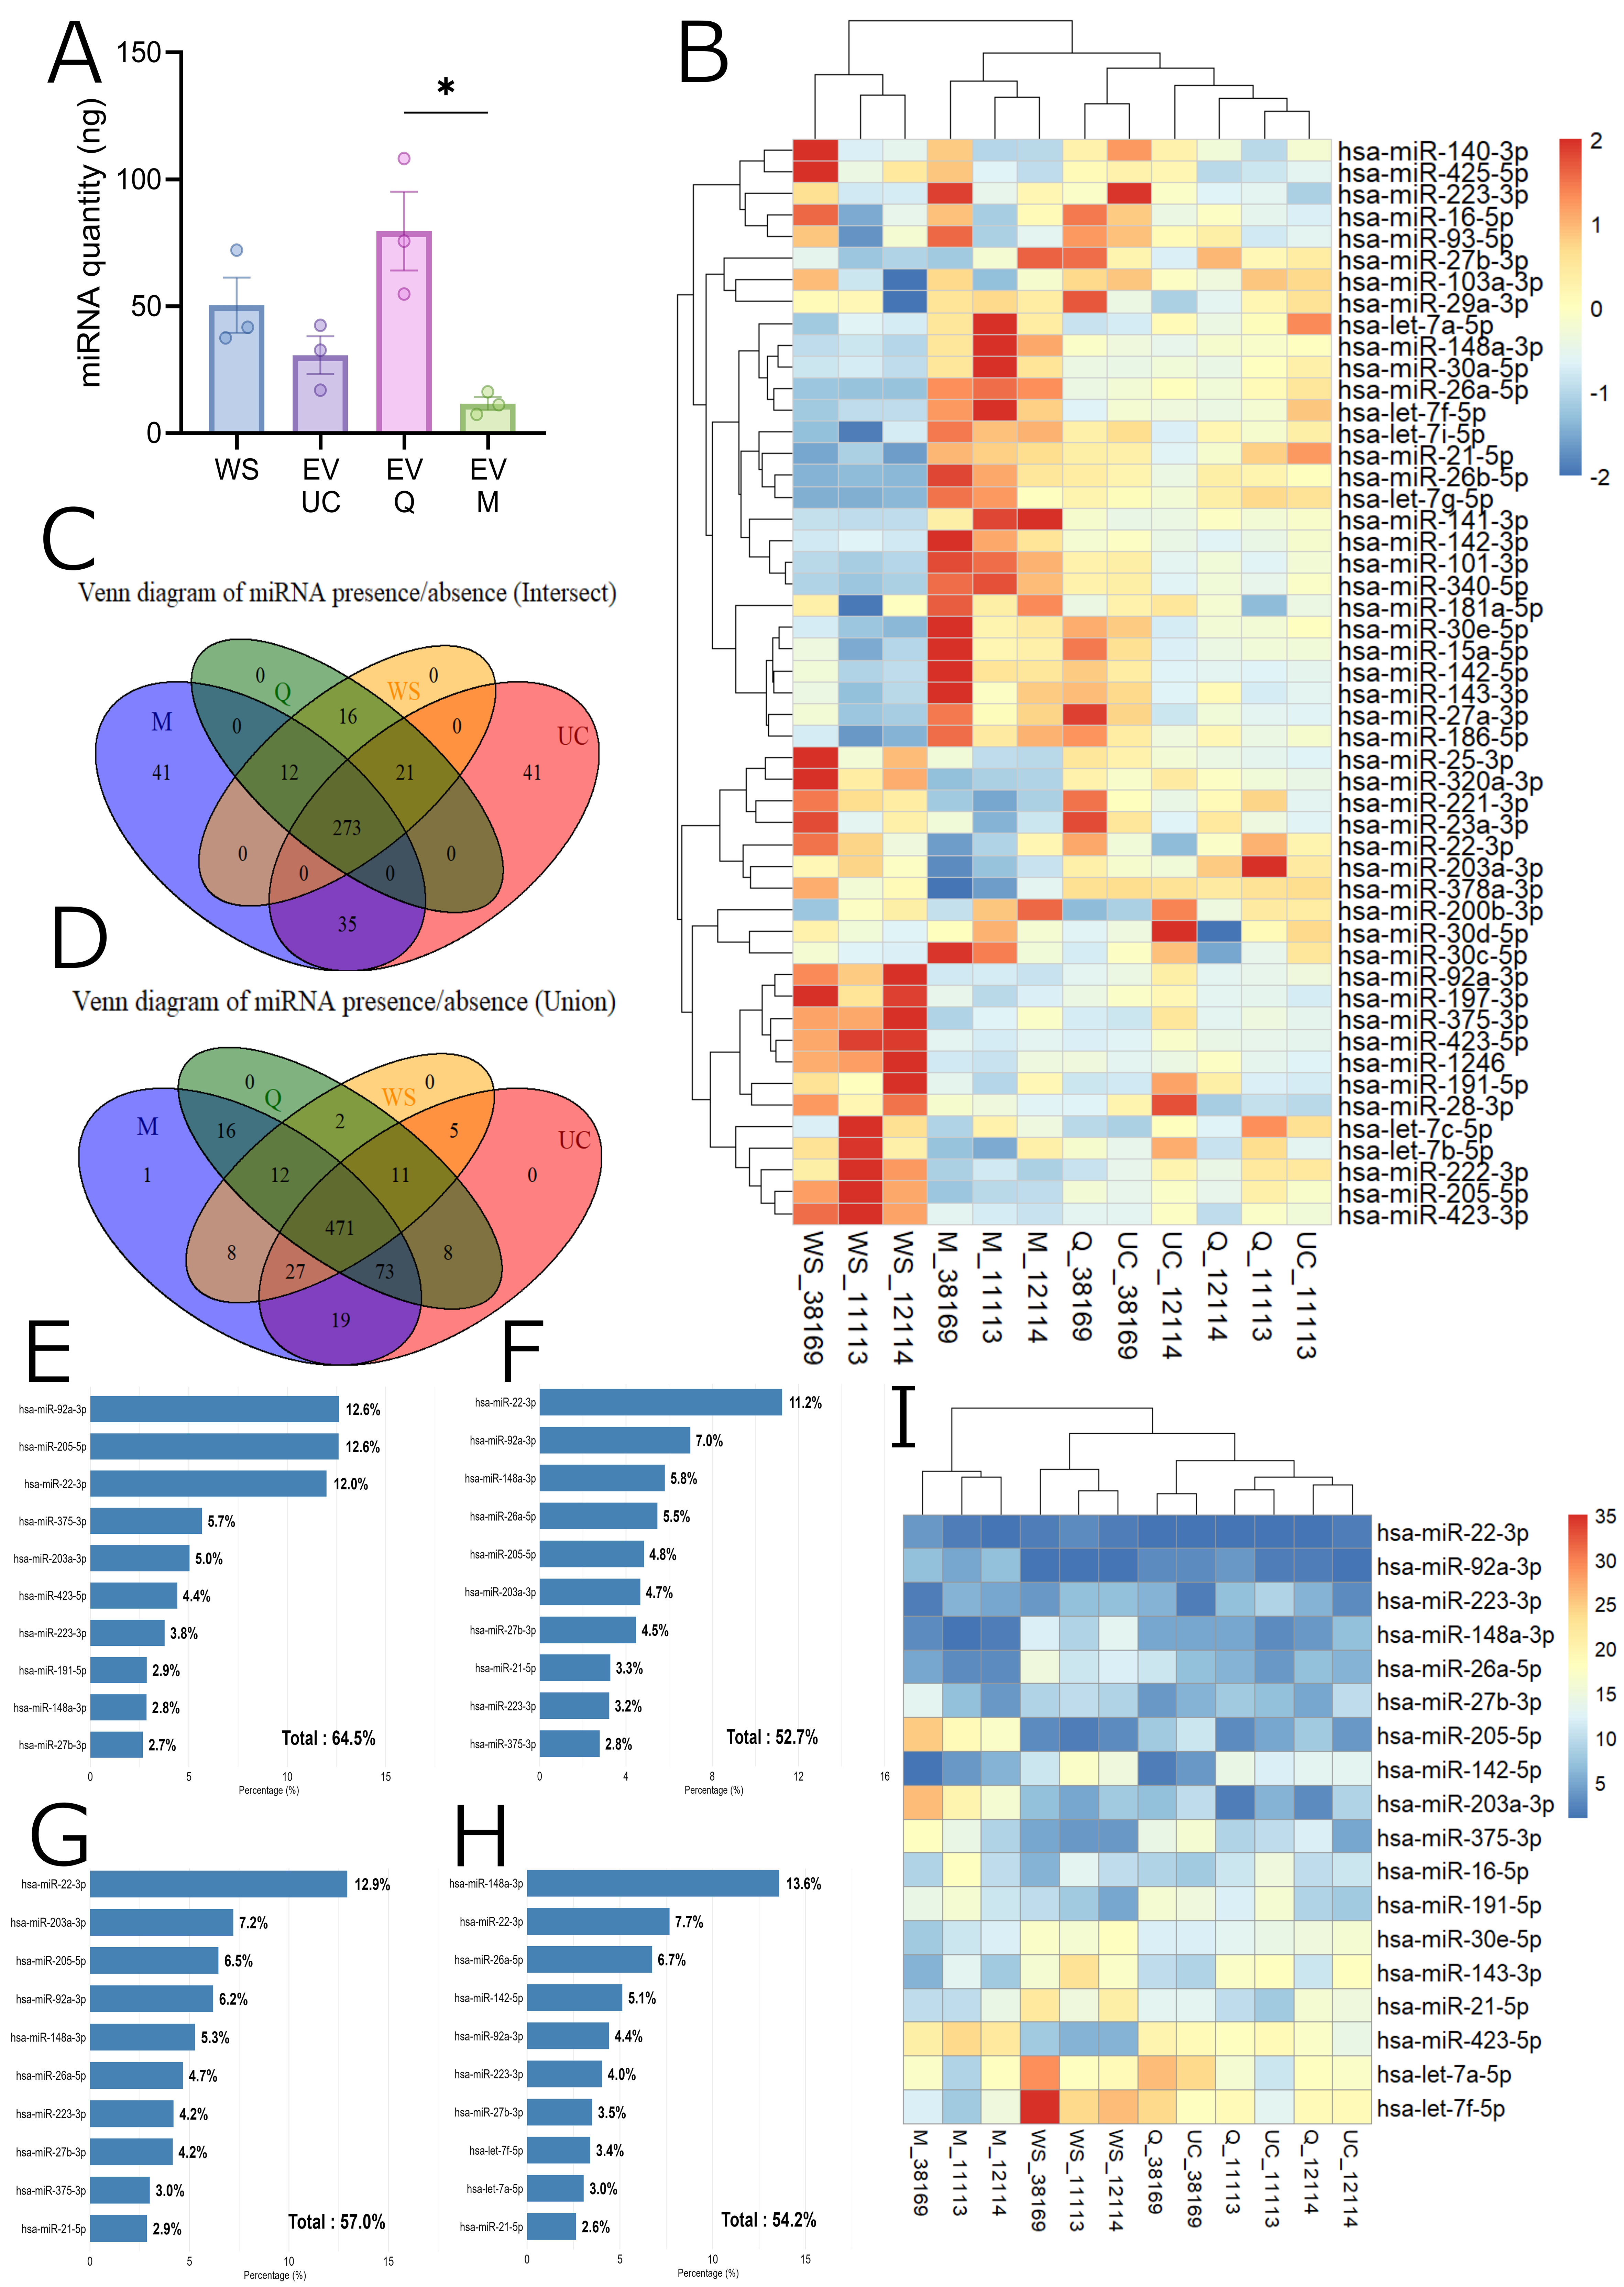
Figure 5. MicroRNA profiling of whole saliva and EV isolates. (A) Total miRNA quantity (mean ± SEM) measured in WS and EV samples isolated by UC, Q, and M. Statistical analyses were performed using GraphPad Prism v10. Kruskal-Wallis tests were applied, followed by Dunn’s post hoc test for multiple comparisons. *P < 0.05; (B) Heatmap of the 50 most abundant miRNAs based on CPM. Values were Z-score normalized (-2 to +2) to highlight relative abundance across conditions (WS, UC, Q, M). The color gradient represents abundance, ranging from low (blue) to high (red); (C and D) Venn diagrams showing the overlap of miRNA species detected in WS, UC, Q, and M. (C) Union: miRNAs detected in at least one replicate per condition. (D) Intersection: miRNAs detected in all three replicates per condition. Colors denote conditions (WS: yellow, UC: red, Q: green, M: purple); (E-H) Bar plots of the 10 most abundant miRNAs in each representative sample (WS_11113, UC_11113, Q_11113, M_11113). Relative abundance is expressed as a percentage of total CPM; (I) Rank-based heatmap of miRNAs appearing among the top 10 positions (by CPM) in at least one sample. The color gradient reflects rank. The x-axis represents individual replicates across conditions; the y-axis lists the top-ranked miRNAs. WS: Whole saliva supernatant; EV: extracellular vesicles; UC: ultracentrifugation; Q: PEG-based co-precipitation; M: immunoaffinity capture; miRNA: microRNA; CPM: counts per million; SEM: standard error of the mean; Z-score: standard score; hsa-miR: Homo sapiens microRNA.


