


fig3
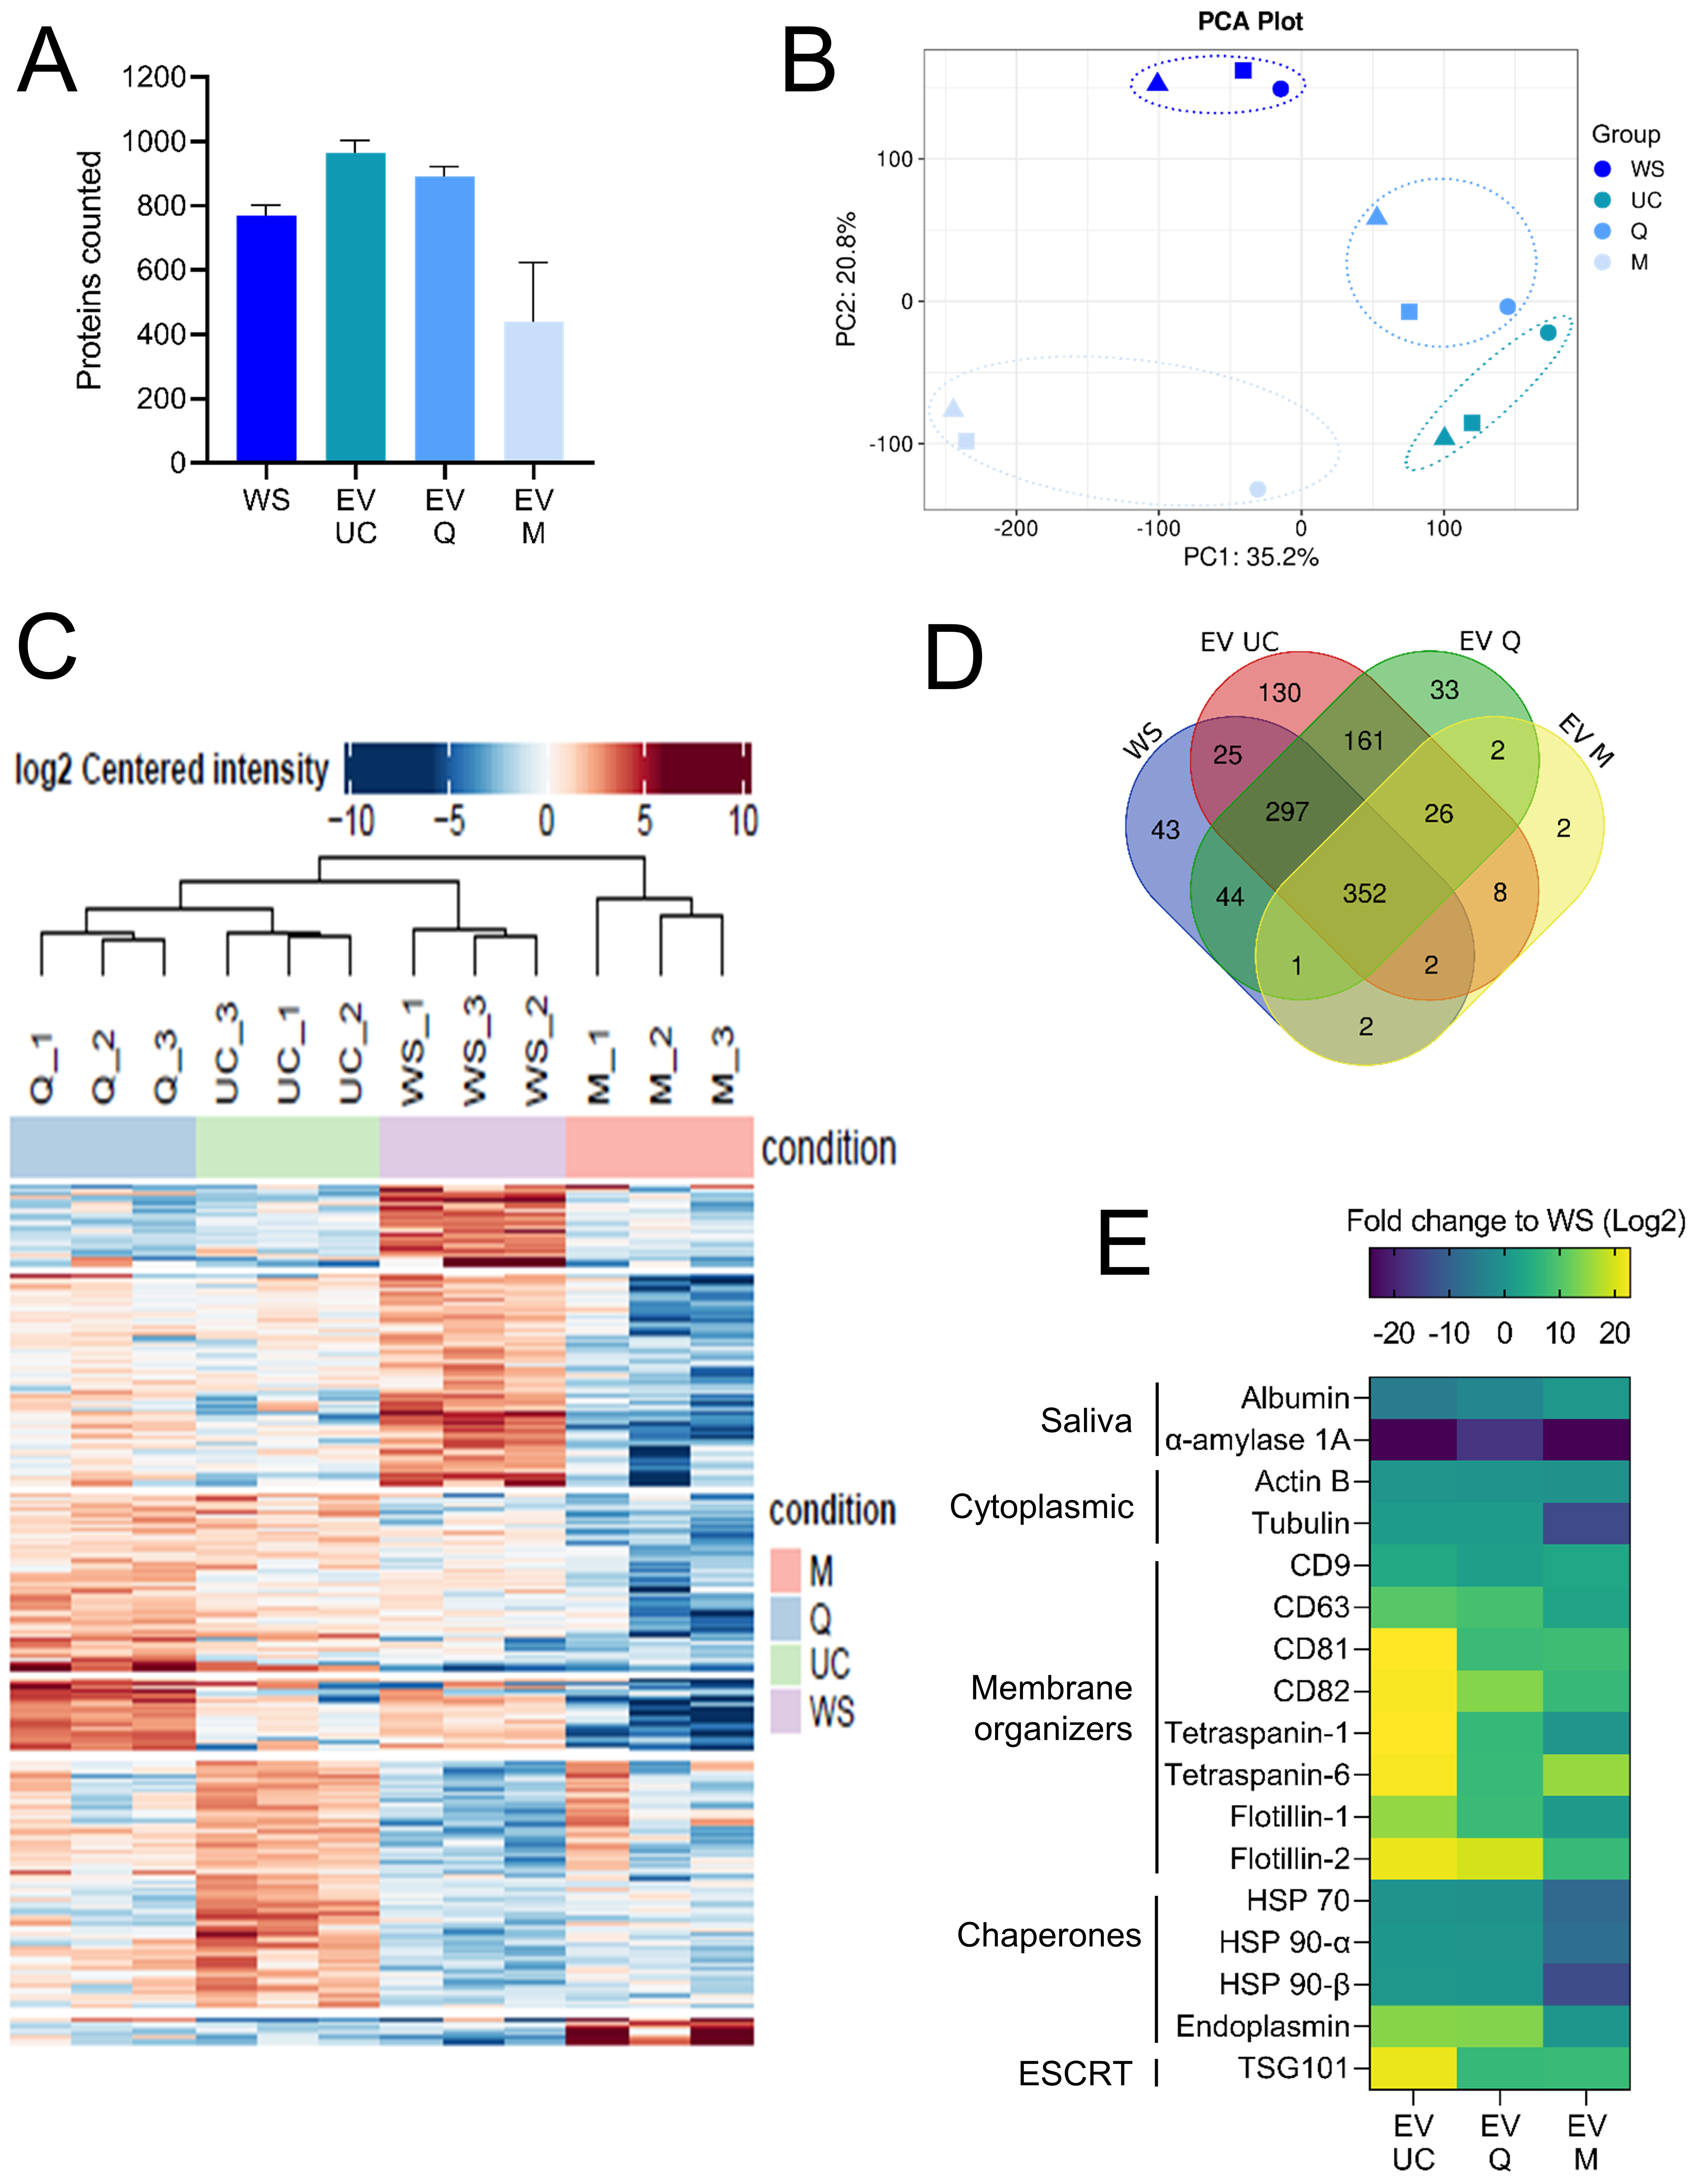
Figure 3. Proteomic analysis of whole saliva and EV fractions. (A) Mean number of proteins identified in WS and in EVs isolated by UC, Q, and M. Proteins were included based on ≥ 2 unique peptides and detection in ≥ 2 of 3 replicates; (B) Principal component analysis of proteomic profiles showing separation between WS and EV samples based on variance in protein expression; (C) Hierarchical clustering heatmap of all samples based on normalized protein abundance; (D) Venn diagram illustrating the overlap of identified proteins among WS (blue), UC- (red), Q- (green), and M- (yellow) derived EVs; (E) Heatmap representing FCs (relative to WS) in UC-, Q-, and M-derived EVs for a subset of proteins commonly reported as salivary or EV-associated markers. WS: Whole saliva supernatant; EV: extracellular vesicles; UC: ultracentrifugation; Q: PEG-based co-precipitation; M: immunoaffinity capture; PCA: principal component analysis; PC1: principal component 1; PC2: principal component 2; HSP: heat shock protein; ESCRT: endosomal sorting complexes required for transport; TSG101: tumor susceptibility gene 101; α-actin: alpha actin; FC: fold change; WS EV: whole saliva EV fraction.


