


fig2
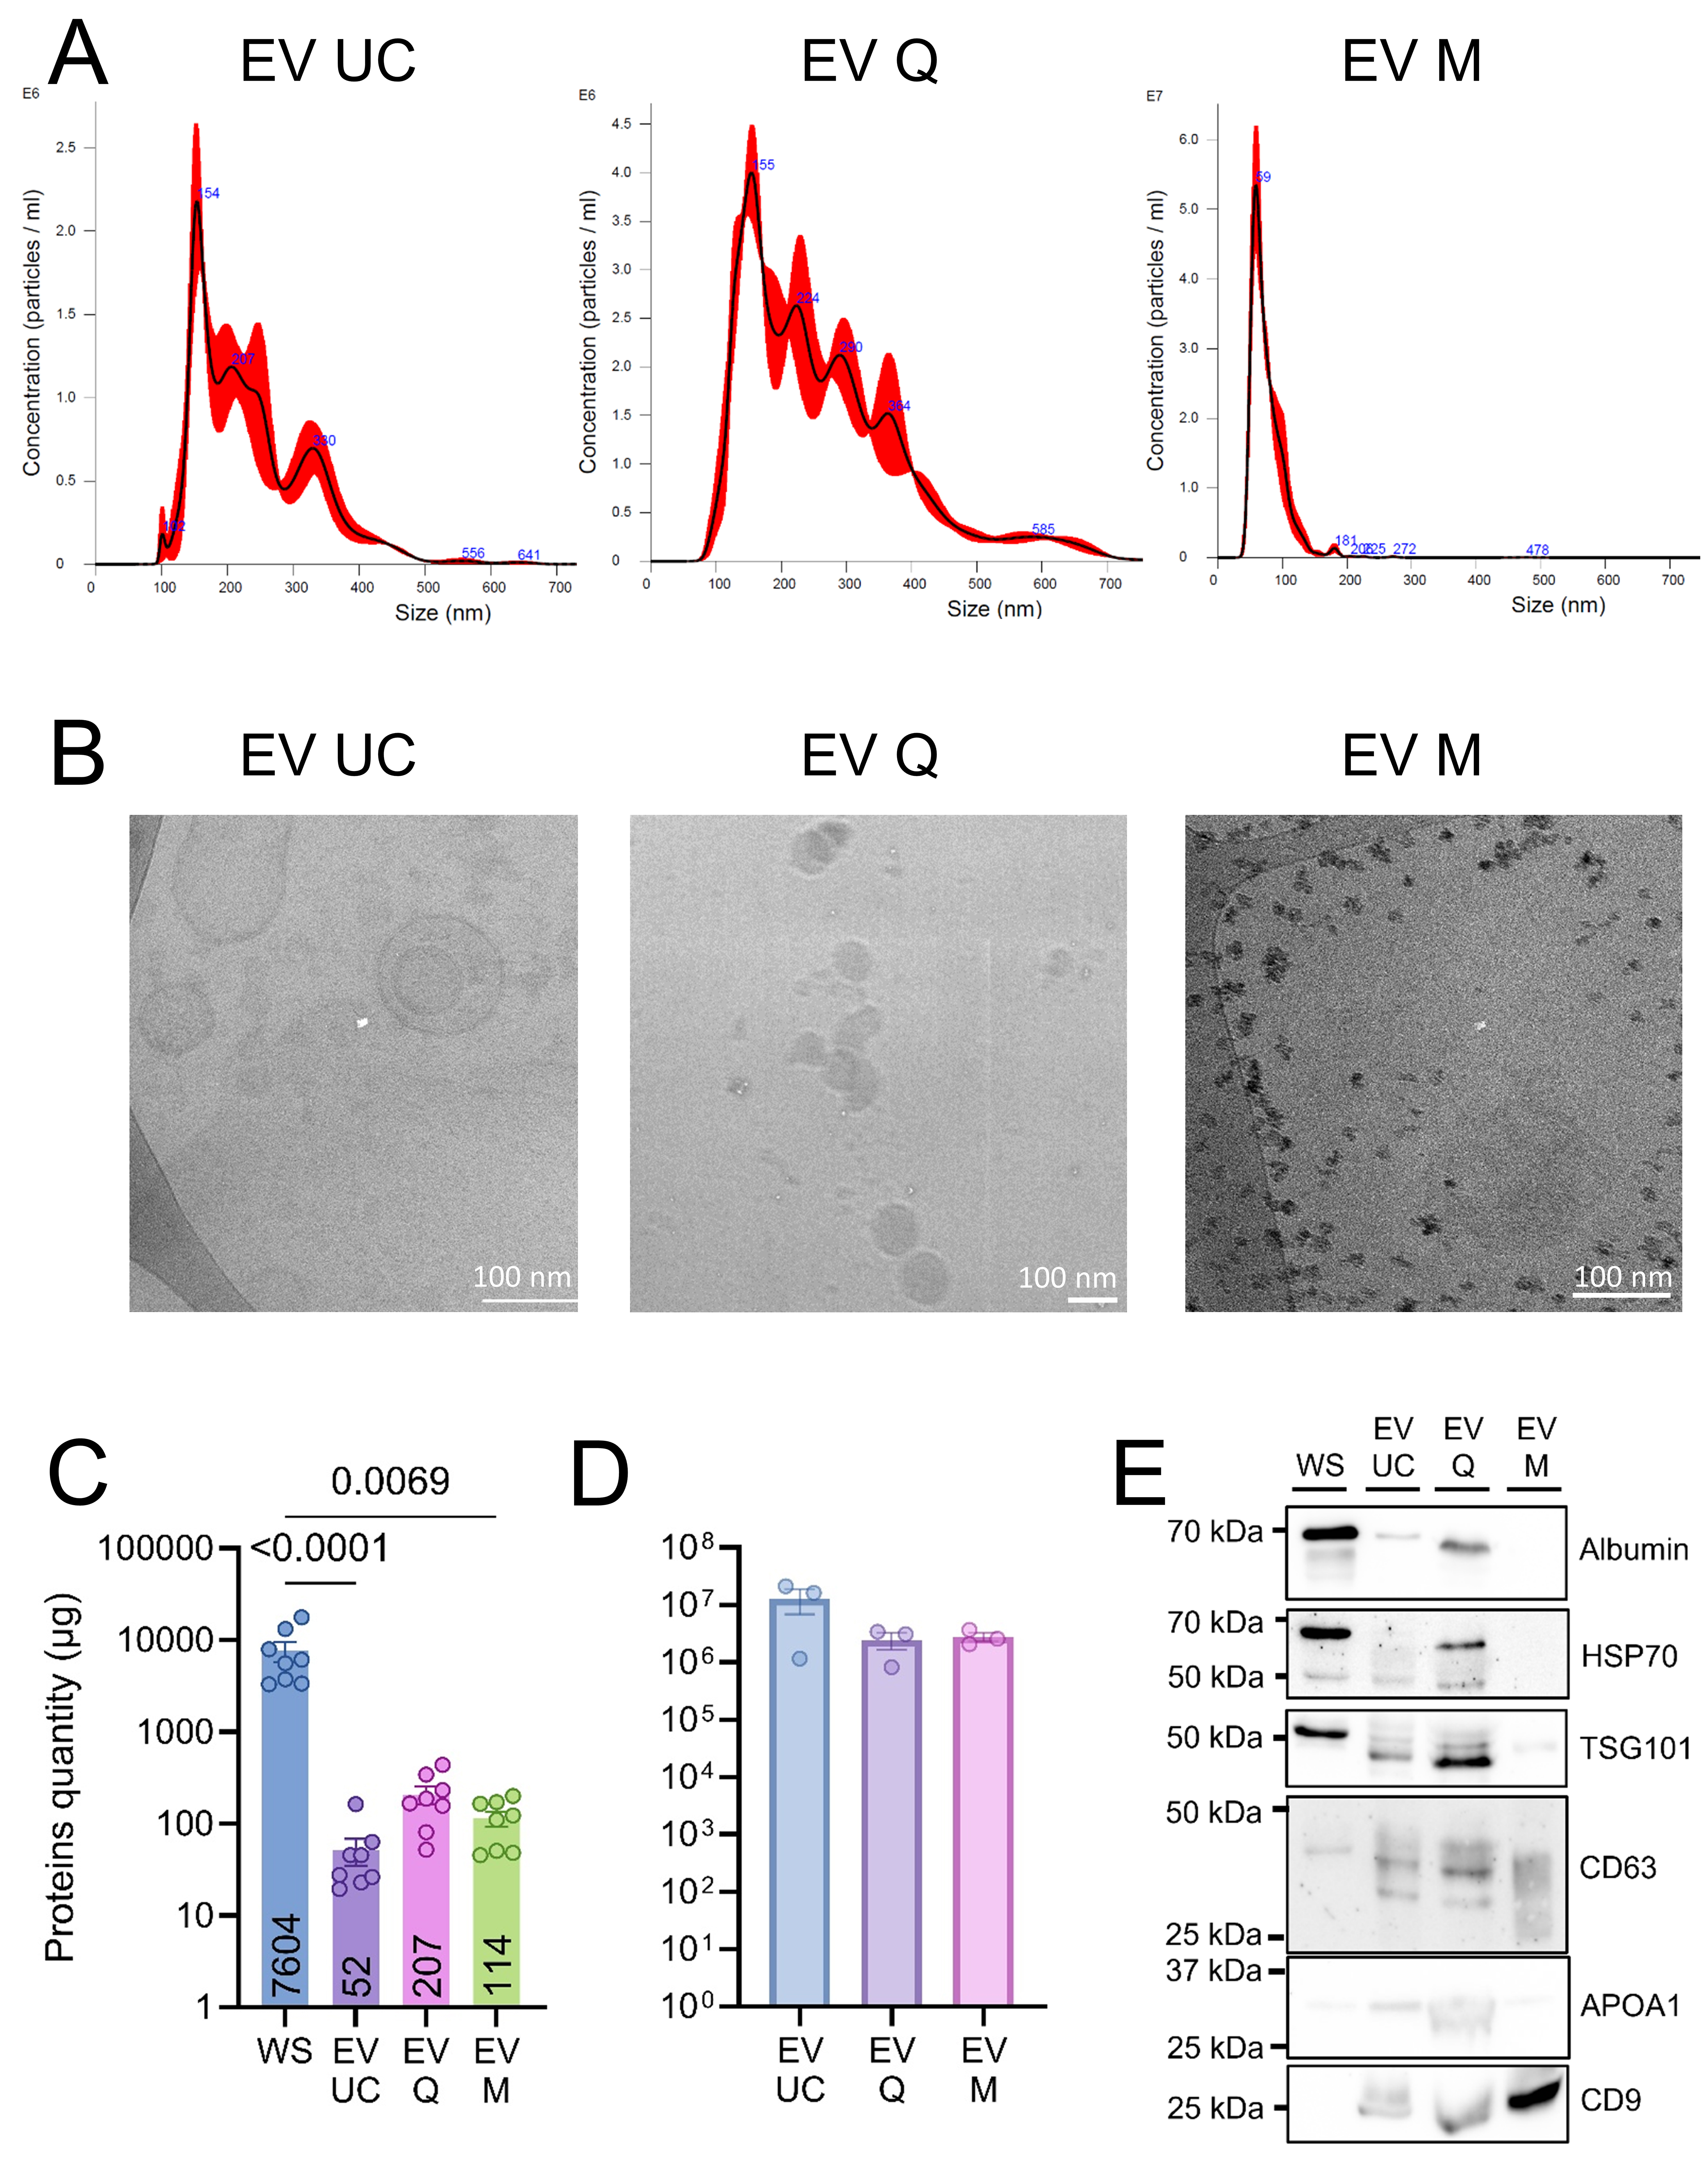
Figure 2. Characterization of human salivary extracellular vesicles. (A) Representative particle size distributions of EVs isolated by UC, Q, and M, as determined by NTA (n = 4); (B) Representative cryo-EM images of EVs obtained using each isolation method (UC, Q, M). Scale bars: 100 nm; (C) Mean protein yield (µg ± SEM) obtained from 1 mL of saliva per isolation method, with numerical values indicated below each bar. Statistical analyses were conducted using GraphPad Prism (version 10) with Kruskal-Wallis tests, followed by Dunn’s post hoc test for multiple comparisons. P < 0.05 was considered statistically significant; (D) EV purity index (mean ± SEM), calculated as the ratio of particle number to total protein content; (E) Western blot analysis of WS samples and EV fractions isolated by UC, Q, and M. Data represent four independent biological replicates, each assessed in three technical replicates. EV: Extracellular vesicles; UC: ultracentrifugation; Q: PEG-based co-precipitation; M: immunoaffinity capture; WS: whole saliva supernatant; NTA: nanoparticle tracking analysis; SEM: standard error of the mean; HSP70: heat shock protein 70; TSG101: tumor susceptibility gene 101; APOA1: apolipoprotein A1; WB: western blot.


