


fig1
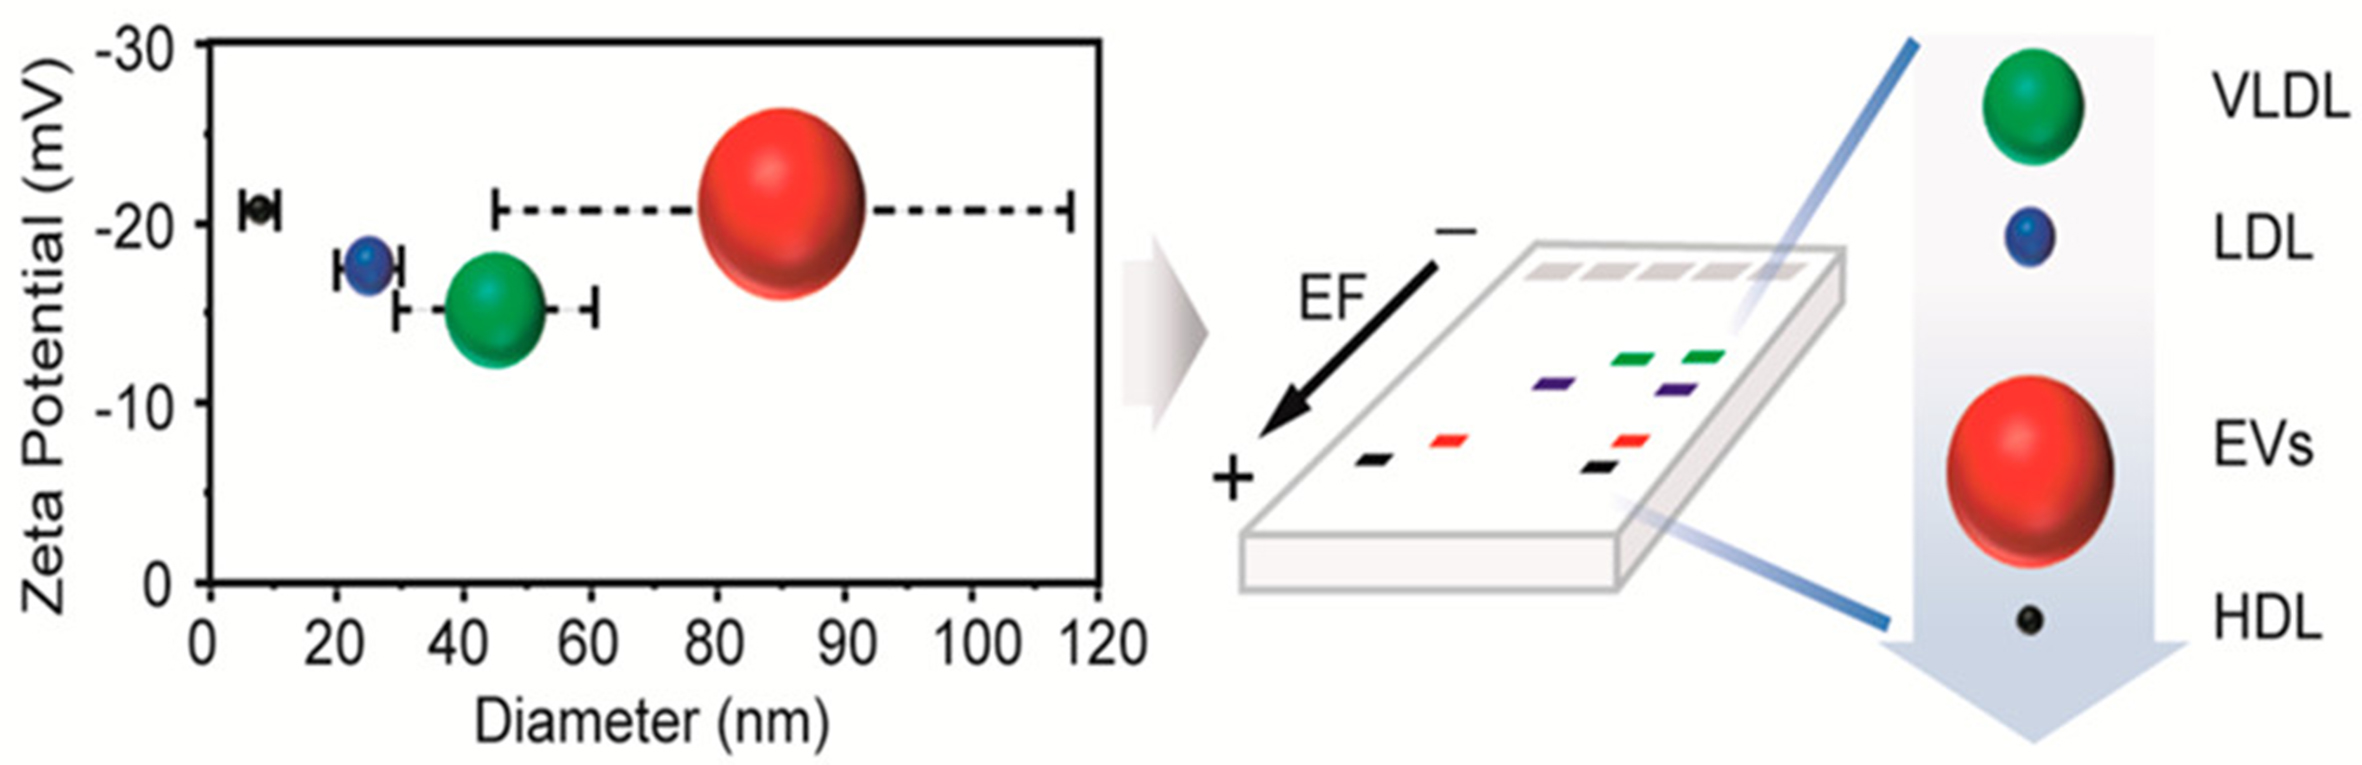
Figure 1. Schematic diagram of the sizes and zeta potentials of EVs and lipoproteins. The diagram illustrates the overlap between HDL, LDL, and VLDL in size and zeta potential with EVs, and the isolation of EVs from lipoproteins using agarose electrophoresis. Reproduced with permission from[153]. EVs: Extracellular vesicles; HDL: high-density lipoprotein; LDL: low-density lipoprotein; VLDL: very low-density lipoprotein; EF: electric field.


