


fig6
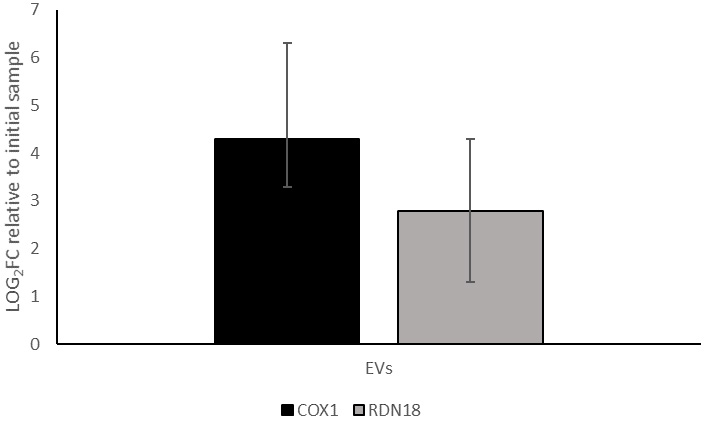
Figure 6. qPCR quantification (log2 FC) of COX1 and RDN18 expression in the EV-enriched fraction obtained from BY4741-pRS316, relative to their levels in the initial cell culture supernatant. Data represent the mean ± standard deviation from three independent experiments. COX1: Cytochrome c oxidase subunit I; RDN18: 18S ribosomal DNA; EV: Extracellular vesicle; qPCR: FC: fold change.


