


fig5
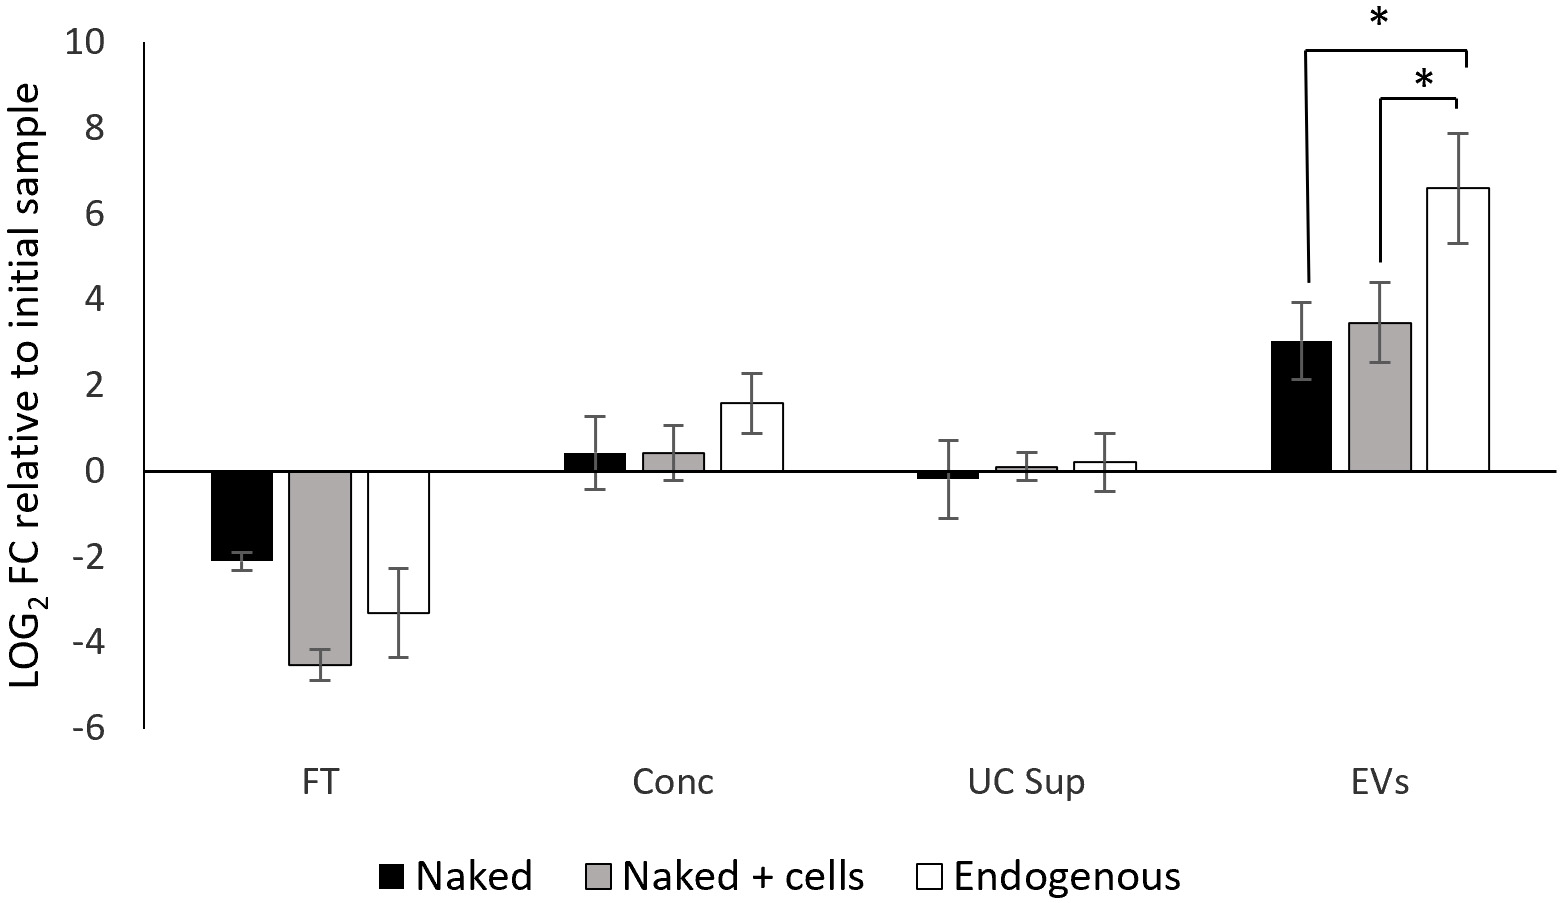
Figure 5. qPCR quantification (log2 FC) of pRS316 plasmid levels across fractions obtained during the EV isolation process, relative to the initial cell culture supernatant. The data are the means ± standard deviation of results from three independent experiments. Significant differences vs. EVs-enriched fraction of both naked plasmid conditions were determined by using the Student’s t-test (*, P < 0.05). Levels of endogenous plasmid were significantly higher compared to naked and naked + cells conditions. FT: Flowthrough; Conc: concentrated sample after tangential flow filtration; UC Sup: ultracentrifugation supernatant; EV: extracellular vesicle; qPCR: quantitative polymerase chain reaction; FC: fold change.


