


fig3
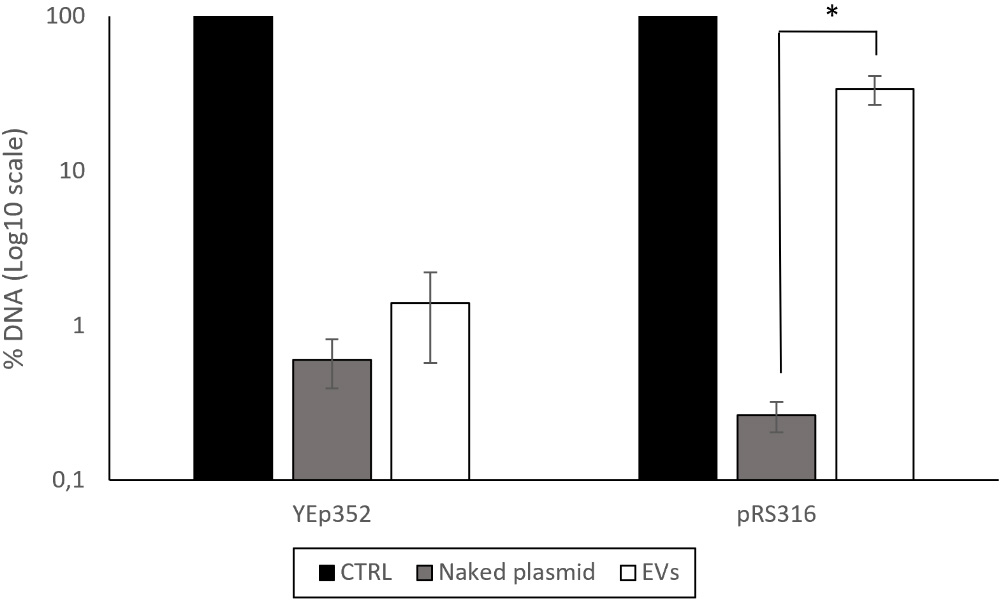
Figure 3. Percentage of DNA remaining after DNase treatment in the EV-enriched fractions isolated from BY4741-YEp352 and BY4741-pRS316. The non-treated sample, shown as the control and set to 100%, was used as the reference for data normalization. As an additional control for DNase activity, naked plasmids were treated at concentrations comparable to those present in the corresponding EV-enriched fractions. Data represent the mean ± standard deviation of three independent experiments. Statistical significance between the DNase-treated EV-enriched fraction and the naked plasmid condition for pRS316 was determined using a Student’s t-test (*, P < 0.05). CTRL: Control; EV: extracellular vesicle.


