


fig2
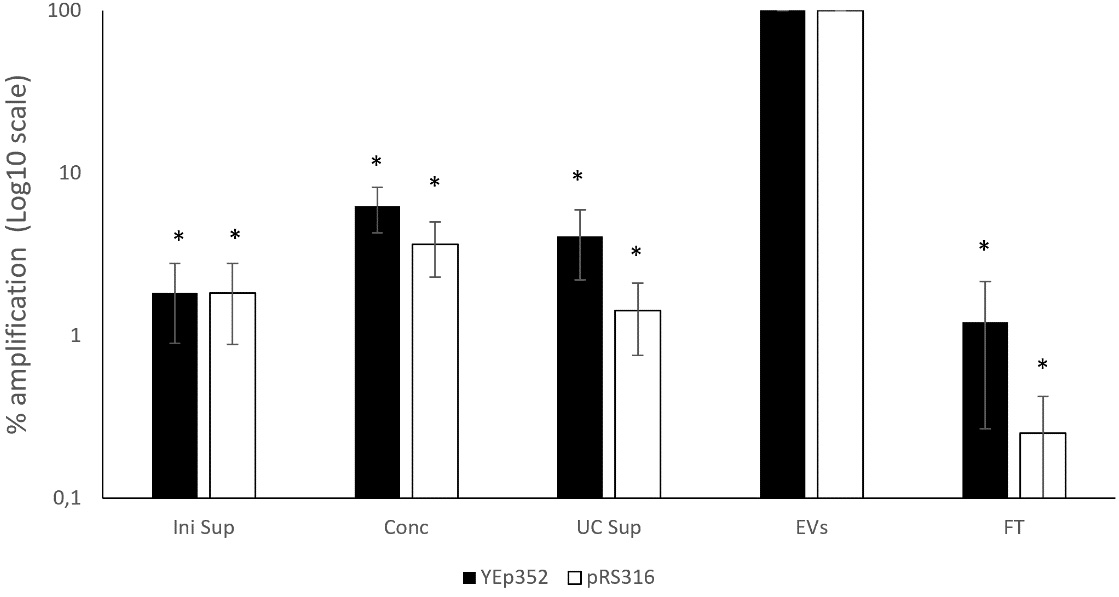
Figure 2. Relative abundance of amplified plasmid DNA across different fractions of the EVs isolation process for BY4741-YEp352 and BY4741-pRS316. Data are normalized to the EV-enriched fraction (set as 100%) and expressed as a percentage relative to the EV fraction. Data represent the mean ± standard deviation from three independent experiments. Significant differences vs. EV-enriched fraction of both plasmids were determined by using the Student’s t-test (*, P < 0.05). Levels of plasmids in the EV-enriched fractions were significantly higher compared to all fractions. For YEp352, significant differences were observed for Ini sup, Conc, UC Sup, and FT. For pRS316, significant differences were observed for Ini sup, Conc, UC Sup, and FT. FT: Flowthrough; Conc: concentrated sample after tangential flow filtration; UC Sup: ultracentrifugation supernatant; EV: extracellular vesicle.


