


fig13
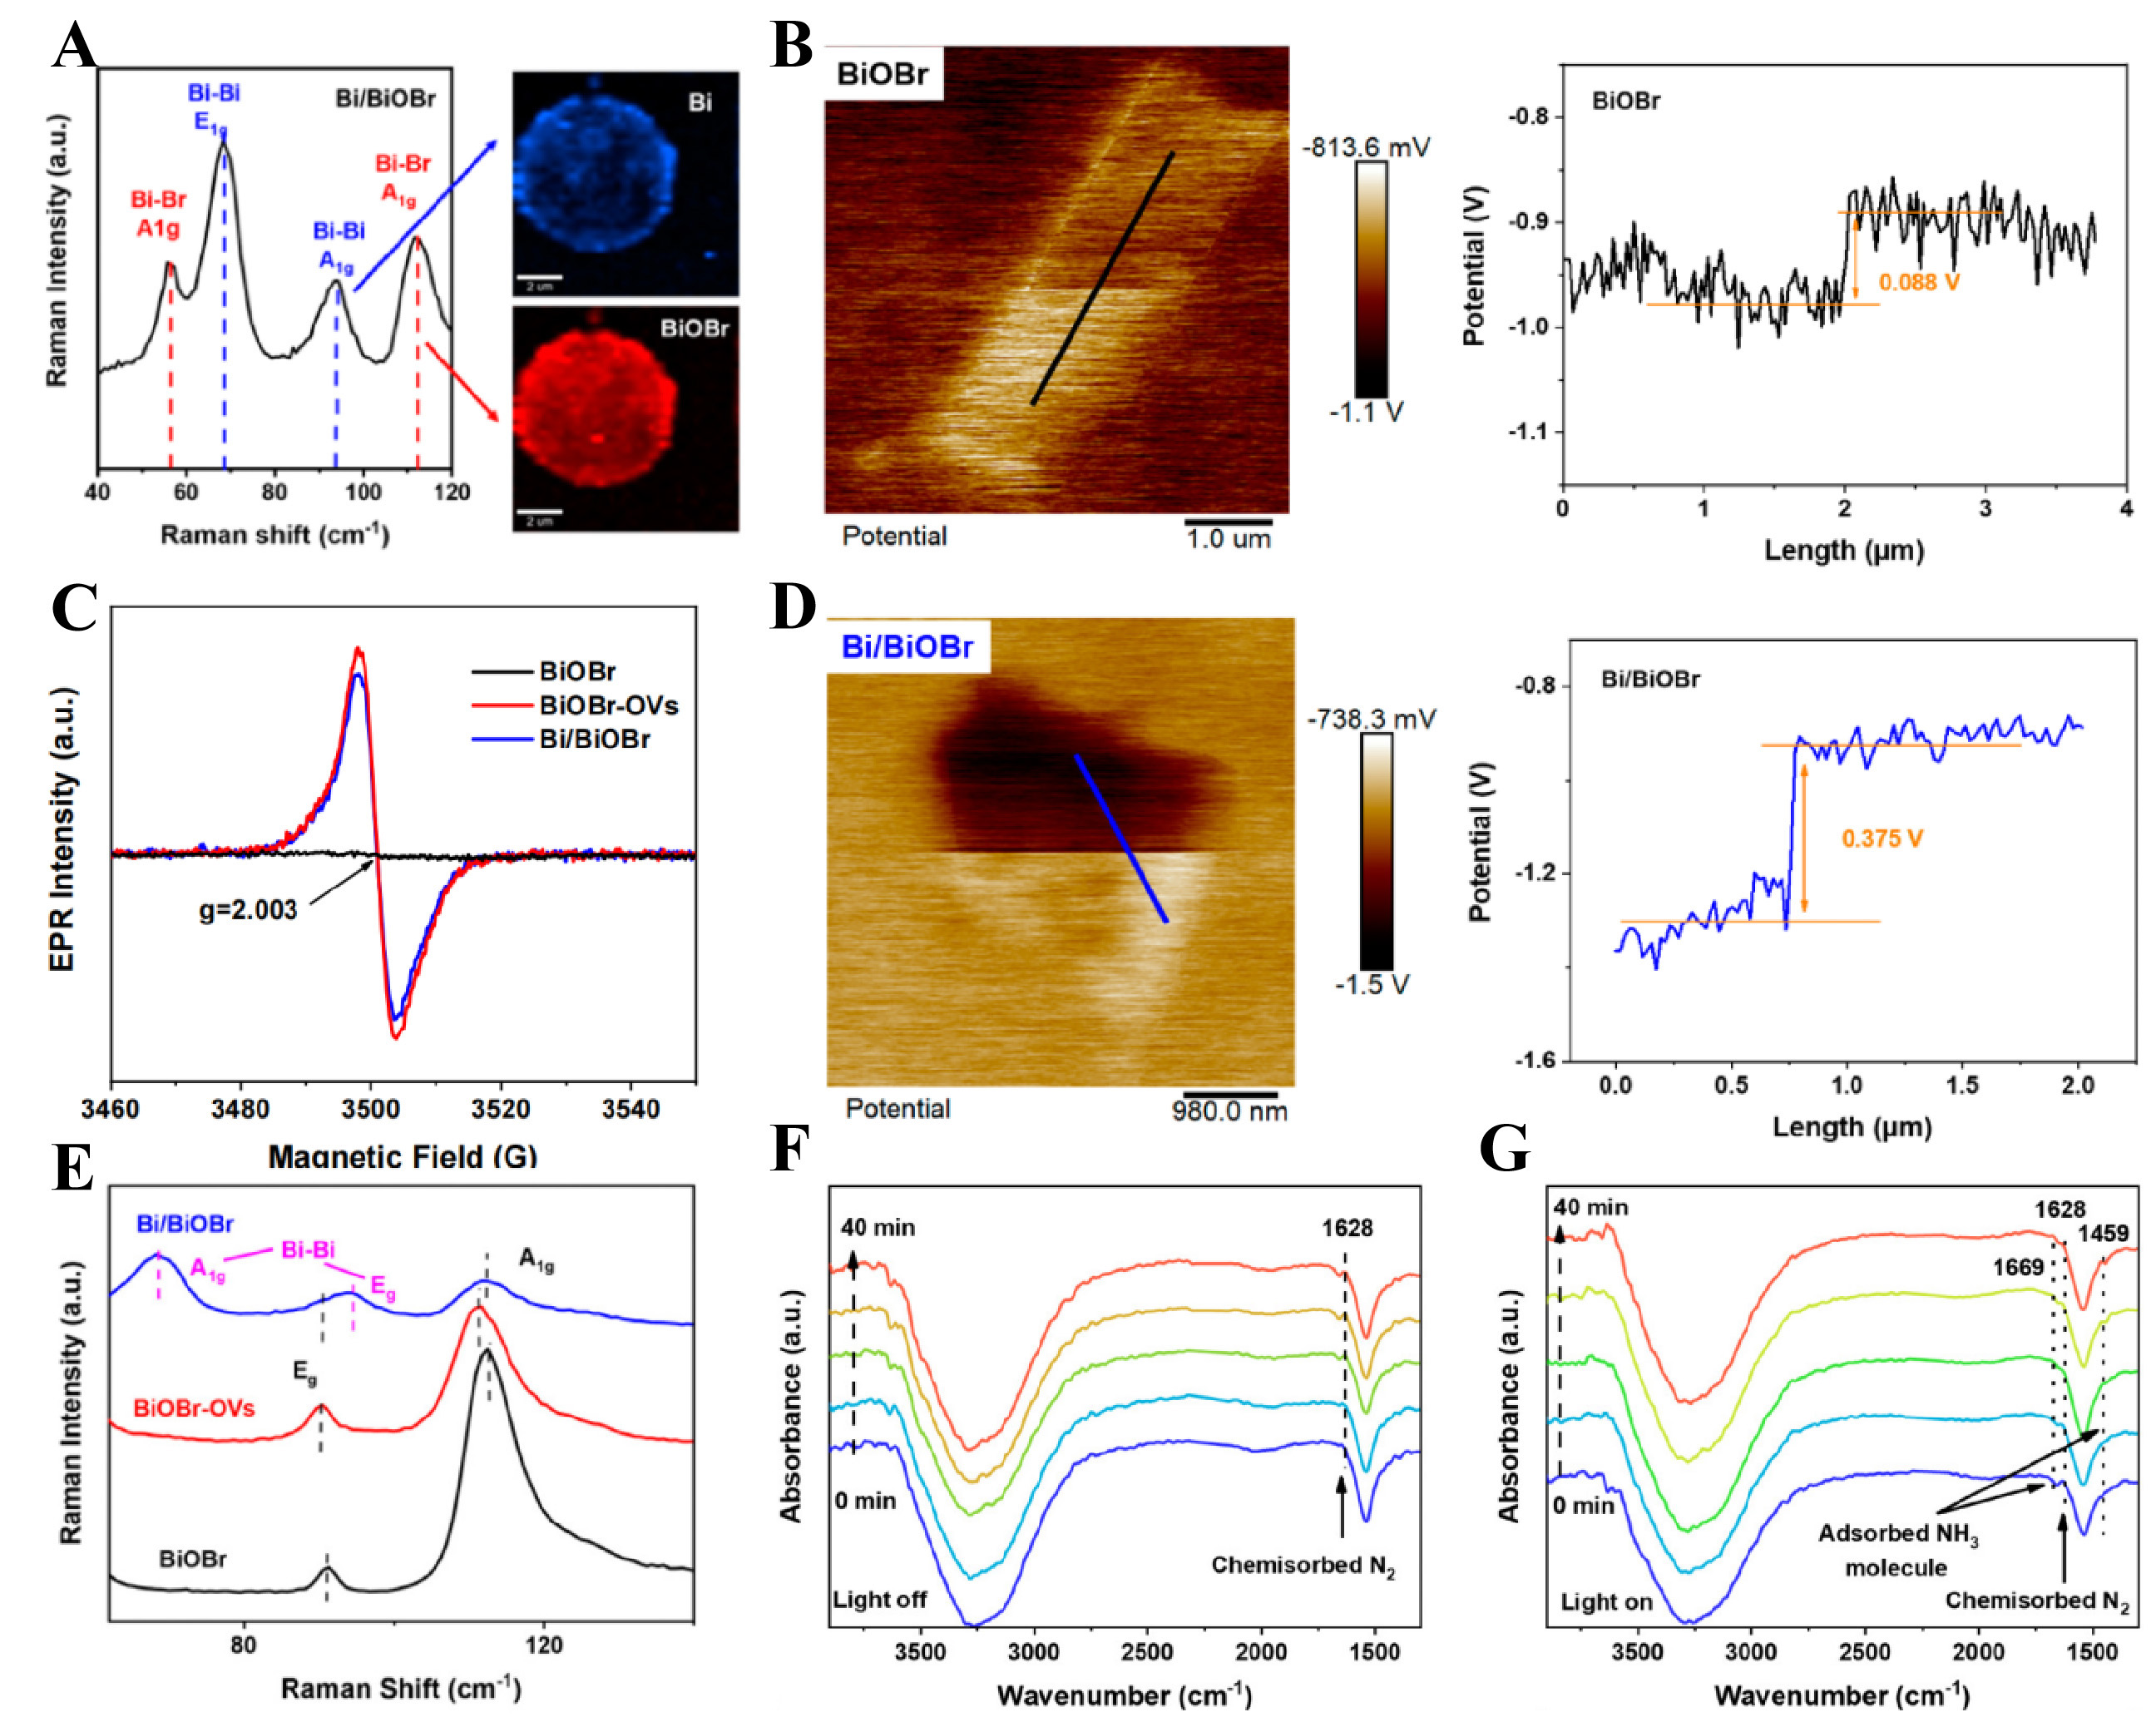
Figure 13. (A) Raman mapping images of the BiOBr, BiOBr-OVs, and Bi/BiOBr. Kelvin probe force microscopy (KPFM) images and the potential change spectrum of the lines: (B) BiOBr, (C) Bi/BiOBr. (D) EPR spectra and (E) Raman spectra of BiOBr, BiOBr-OVs, and Bi/BiOBr. Characterization of photocatalytic nitrogen fixation: in situ FTIR spectra with (F) light off and (G) light on. (A-G) Reproduced with permission from[140]. Copyright 2024, American Chemical Society. EPR: Electron paramagnetic resonance; FTIR: fourier transform infrared spectroscopy; OVs: oxygen vacancies.


