


fig5
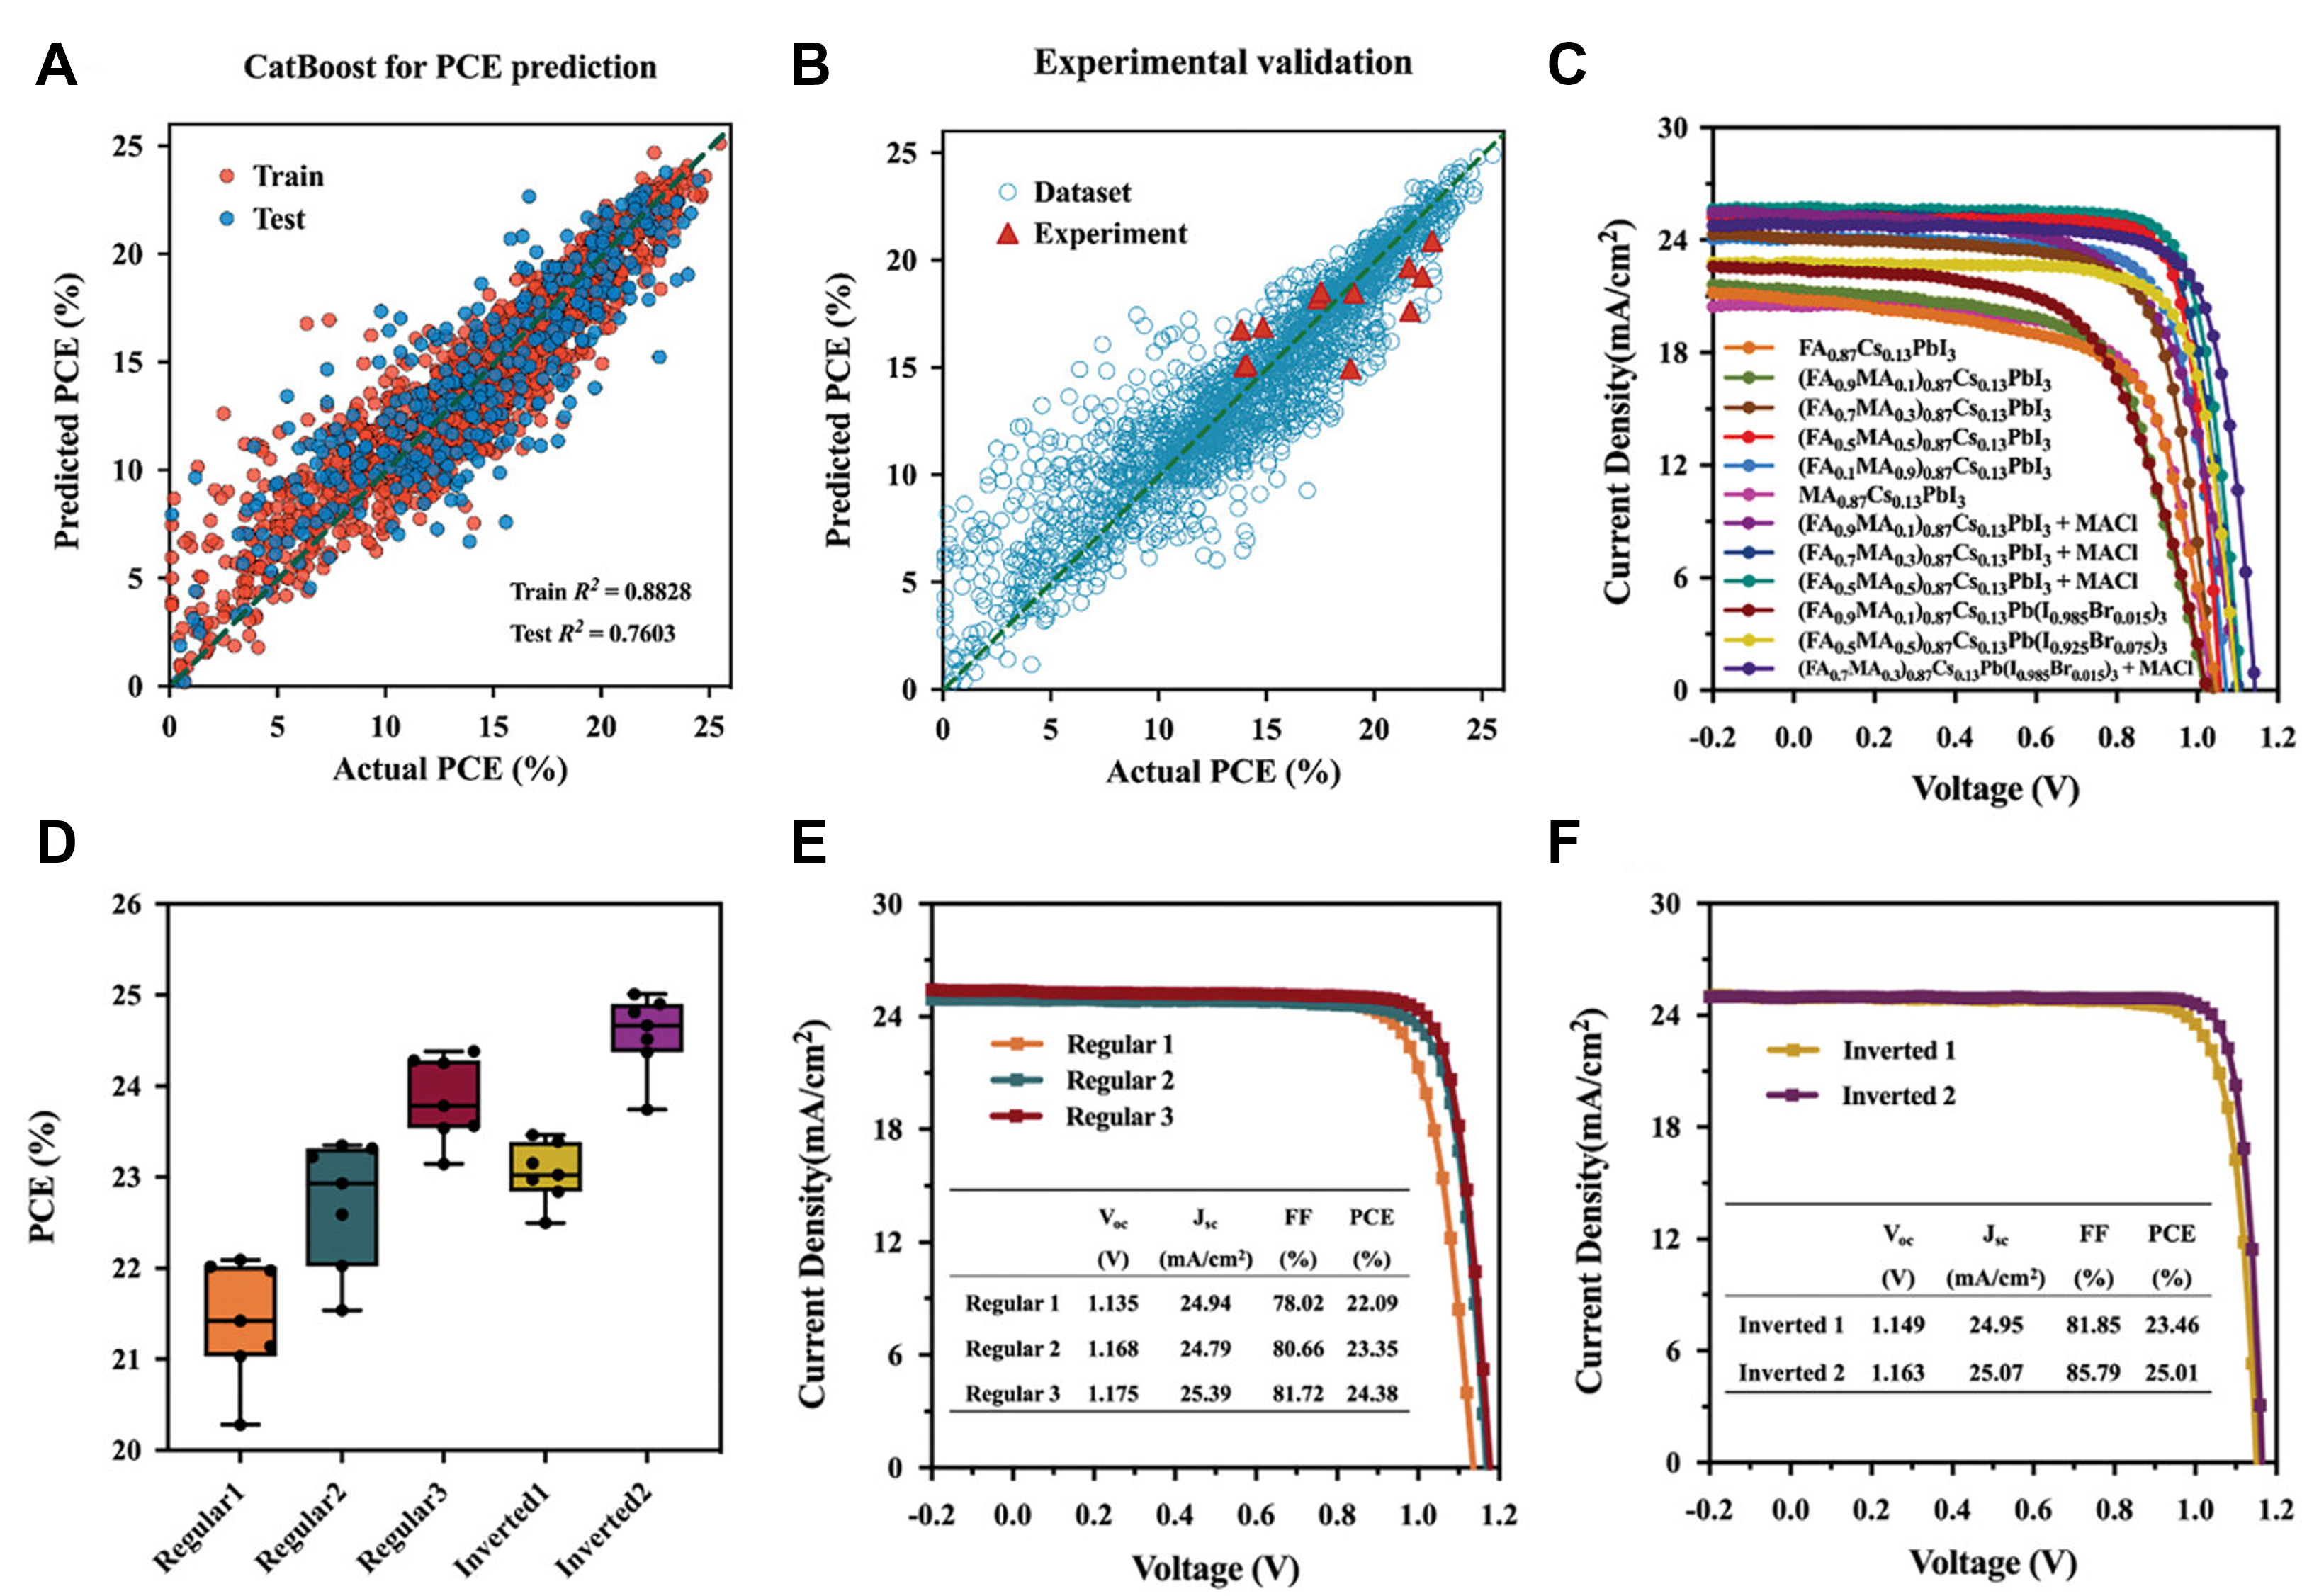
Figure 5. Machine learning model prediction and experimental photovoltaic performance of perovskite solar cells. (A) The fitting graph of PCE results by the CatBoost-based algorithm model, where red represents the training set and blue represents the test set. Reprinted with permission[162]. Copyright 2024, John Wiley and Sons. (B) The distribution of experimental results and data points from the database in the fitting graph. Reprinted with permission[162]. Copyright 2024, John Wiley and Sons. (C) J-V curves of devices with different perovskite components via a two-step spin-spin sequential deposition method. Reprinted with permission[162]. Copyright 2024, John Wiley and Sons. (D) Statistics of the PCE of PSCs with different groups based on 7 devices. The central line represents the median, the box limits correspond to the upper and lower quartiles, and the whiskers extend to the minimum and maximum values. Reprinted with permission[162]. Copyright 2024, John Wiley and Sons. (E) J-V curves of the regular devices and their champion photovoltaic performance. Reprinted with permission[162]. Copyright 2024, John Wiley and Sons. (F) J-V curves of the inverted devices and their champion photovoltaic performance. Reprinted with permission[162]. Copyright 2024, John Wiley and Sons.


