


fig2
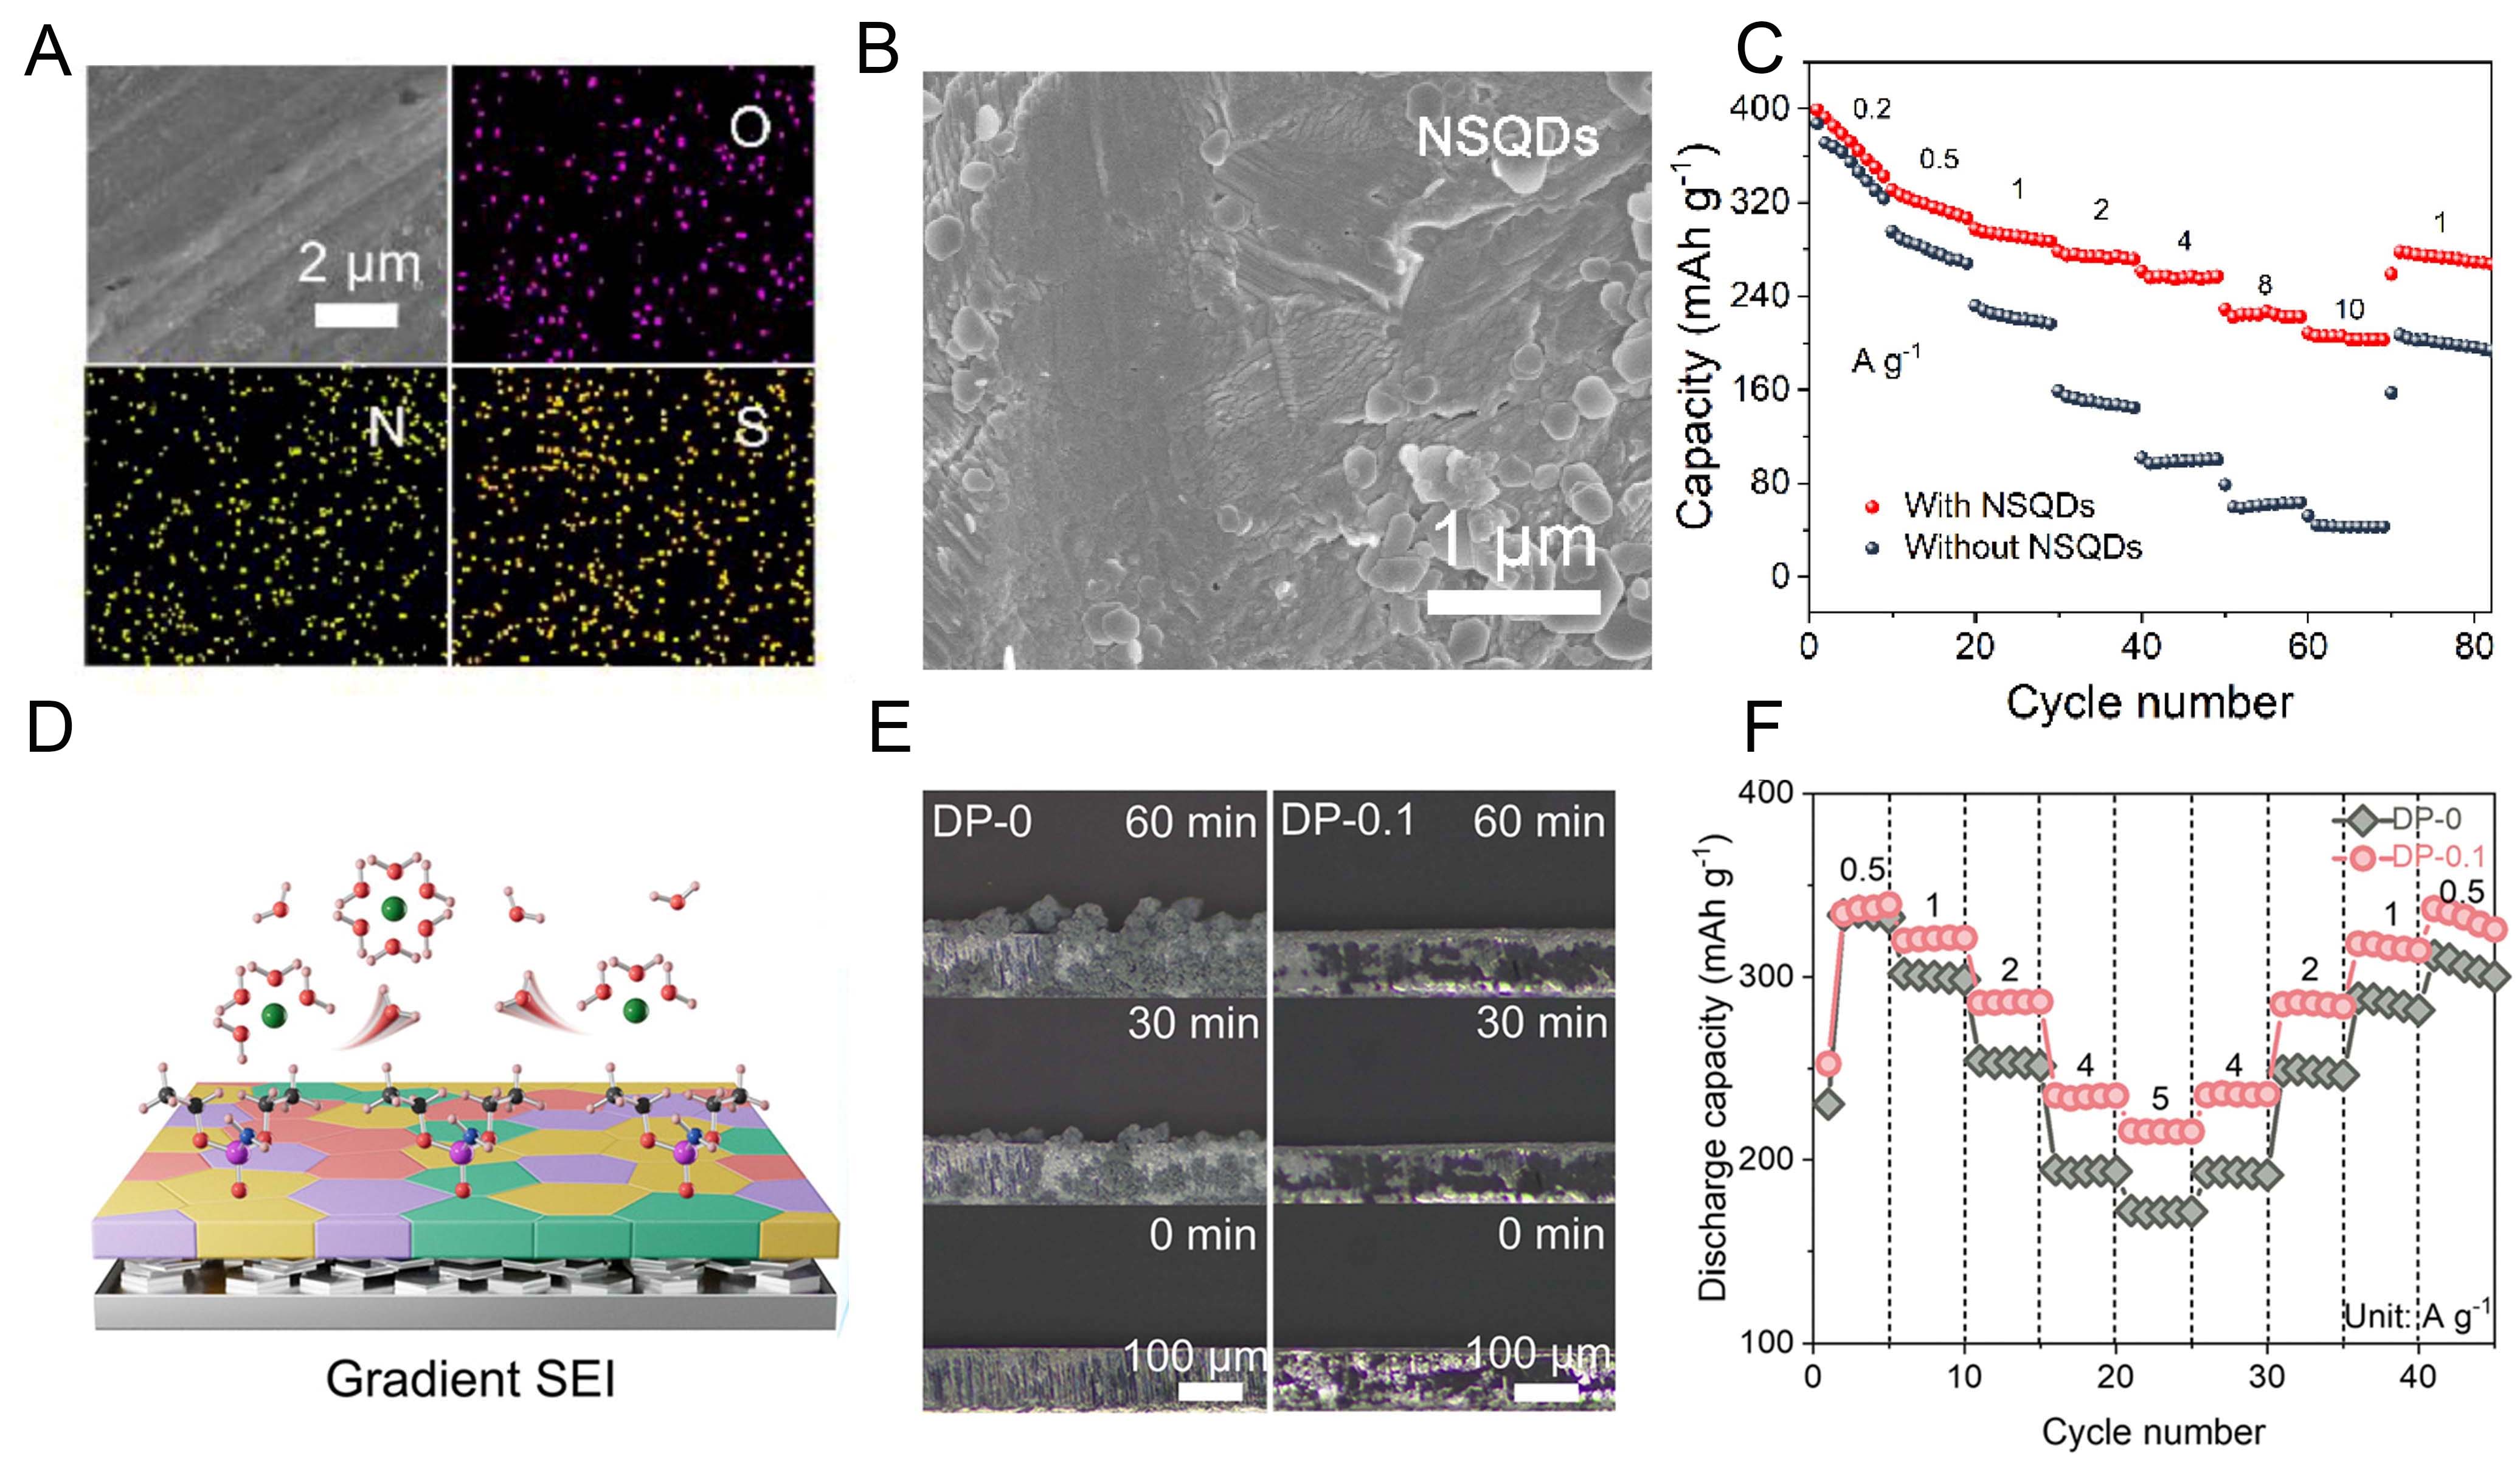
Figure 2. (A) SEM image and corresponding EDS mapping of the Zn electrode, which is soaked with the NSQDs dispersion[71]. (B) SEM image after 10 cycles at 10 mA cm-2 and 0.5 mAh cm-2 with the NSQDs additive[71]. (C) Rate performance comparison of Zn-ZVO with and without NSQDs[71]. (A-C) Reproduced with permission from[71]. Copyright 2023, Elsevier. (D) Schematic illustration of the DP additive effect at the electrode/electrolyte interface[77]. (E) Operando optical microscopy images of Zn deposition in DP-0 and DP-0.1 electrolytes at 5 mA cm-2[77]. (F) Rate capability of Zn||NVO full cells with DP-0 and DP-0.1 electrolytes[77]. (D-F) Reproduced with permission from[77]. Copyright 2025, Royal Society of Chemistry.


