



fig6
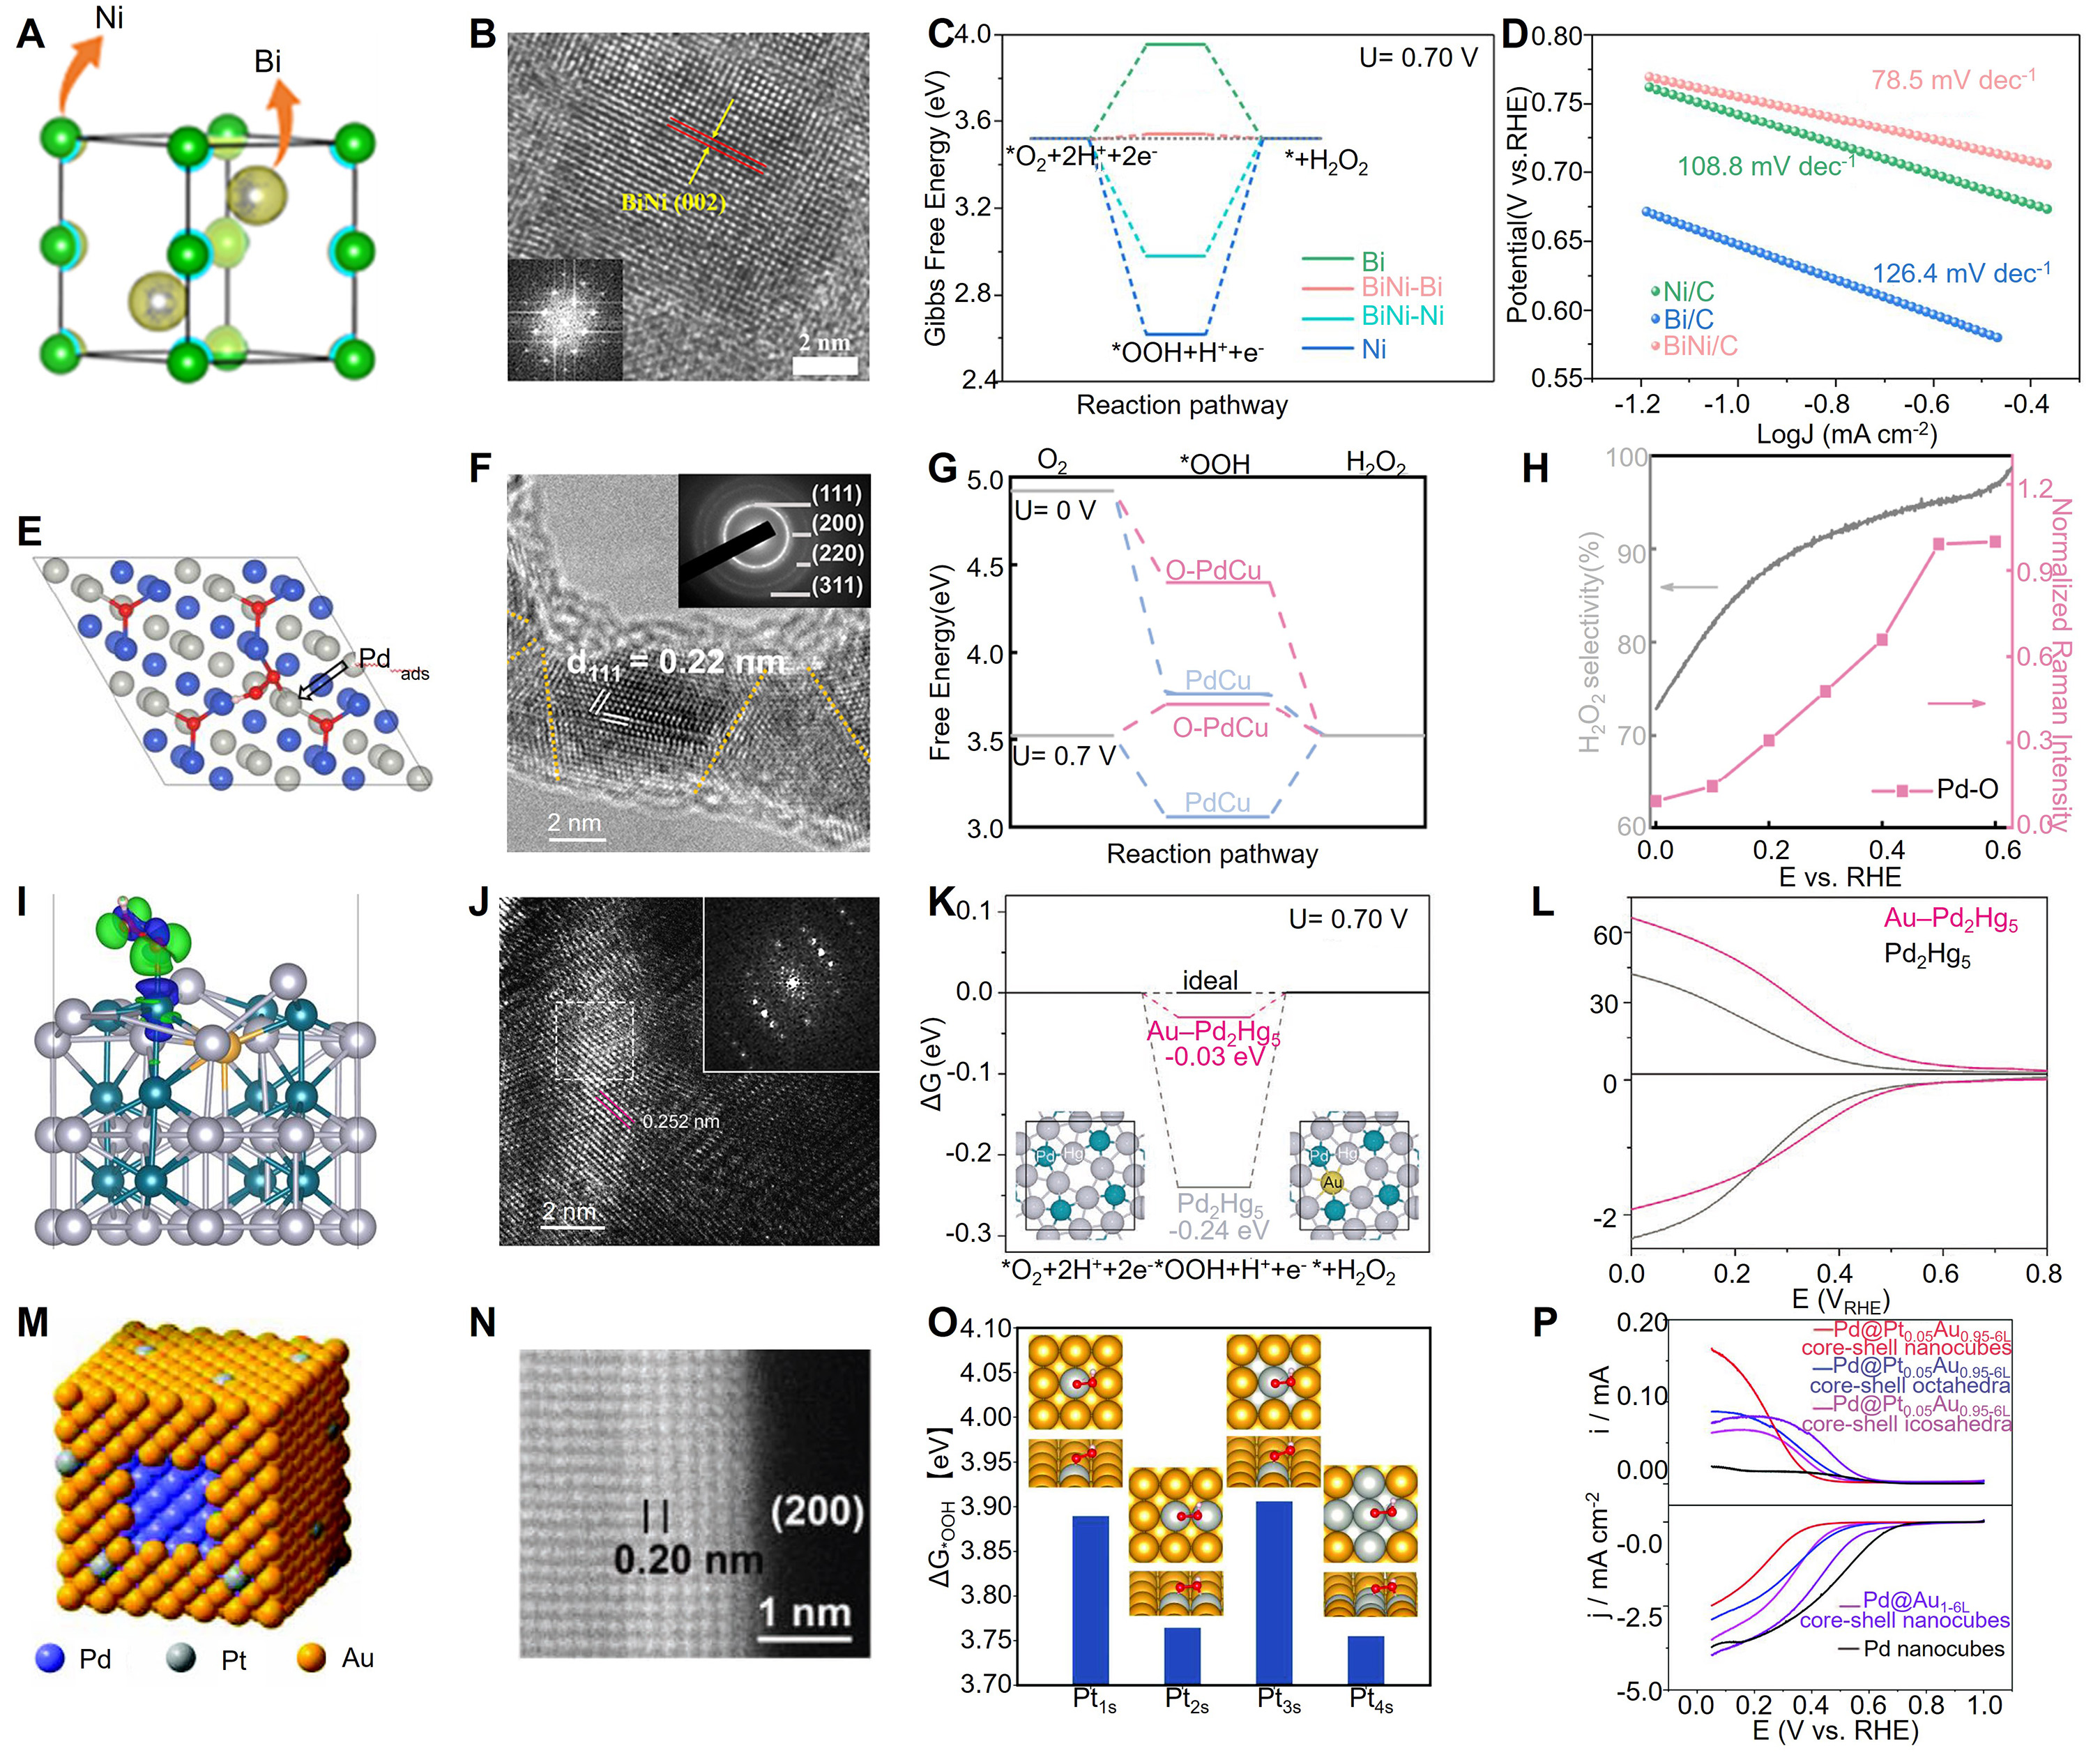
Figure 6. (A) Three-dimensional charge-density diagrams of the BiNi alloys. (B) HR-TEM image of BiNi/C, with the corresponding diffractogram shown in the inset. (C) OOH adsorption configurations on Bi, Ni, BiNi-Bi, and BiNi-Ni sites, and the corresponding free-energy diagrams at 0.7 V vs. RHE. (D) Tafel slopes of Ni/C, Bi/C, and BiNi/C samples. (A-D) is reprinted with permission from Ref.[147]. Copyright © 2025 American Chemical Society. (E) Computational model of the OOH adsorption configuration on an oxygen-containing PdCu surface. Silver, blue, and red spheres represent Pd, Cu, and O atoms, respectively. (F) HR-TEM image of PdCu nanowires, with the SAED pattern shown in the inset. (G) Calculated free-energy diagrams for the 2e- ORR over bare PdCu and oxygen-containing PdCu. (H) H2O2 selectivity of the PdCu NWs/C ORR catalyst and normalized Raman intensities of Pd-O. (E-H) is reprinted with permission from Ref.[148]. Copyright © 2023 American Chemical Society. (I) Charge-density difference of Au-Pd2Hg5 (001) induced by OOH adsorption. Green and blue regions represent electron accumulation and depletion, respectively; the isosurface value is 0.004 e Å-3. (J) HR-TEM image of the heterometal-doped M-Pd2Hg5 aerogel. (K) Calculated reaction-coordinate diagrams for Pd2Hg5 and Au-Pd2Hg5 aerogels, with insets showing the corresponding atomic configurations. This model represents the (100) plane of the Pd2Hg5 structure. (L) LSV curves of Pd2Hg5 and Au-Pd2Hg5 aerogels in O2-saturated 0.1 M HClO4 at a rotation speed of 1,600 rpm and a scan rate of 20 mV s-1, together with the detected H2O2 currents on the Pt ring electrode at a fixed potential of 1.2 V vs. RHE. (I-L) is reprinted with permission from Ref.[149]. Copyright © 2023 Wiley-VCH GmbH. (M) Structural illustration of the obtained Pd@Pt0.05Au0.95 core-shell nanocube covered by facets and the corresponding Pt-in-Au square atomic arrangement. (N) HAADF-STEM image of Pd@Pt0.05Au0.95-6L core-shell nanocubes. (O) ΔG*OOH values for Pd@Pt-in-Au (100) surfaces with Pt aggregates of different sizes embedded in the Au matrix. In Ptnx, n and x denote the number of Pt atoms and the *OOH adsorption arrangement, respectively, where e and s refer to end-on and side-on adsorption. (P) Electrocatalytic ORR performance of Pd@M-in-Au core-shell nanocrystals measured by RRDE in O2-saturated 0.1 M HClO4, where M = Pt, Pd, and Rh. The upper panel shows ring-current polarization curves, and the lower panel shows disk-current-density polarization curves. (M-P) is reprinted with permission from Ref.[150]. Copyright © 2024 Wiley-VCH GmbH.