


fig14
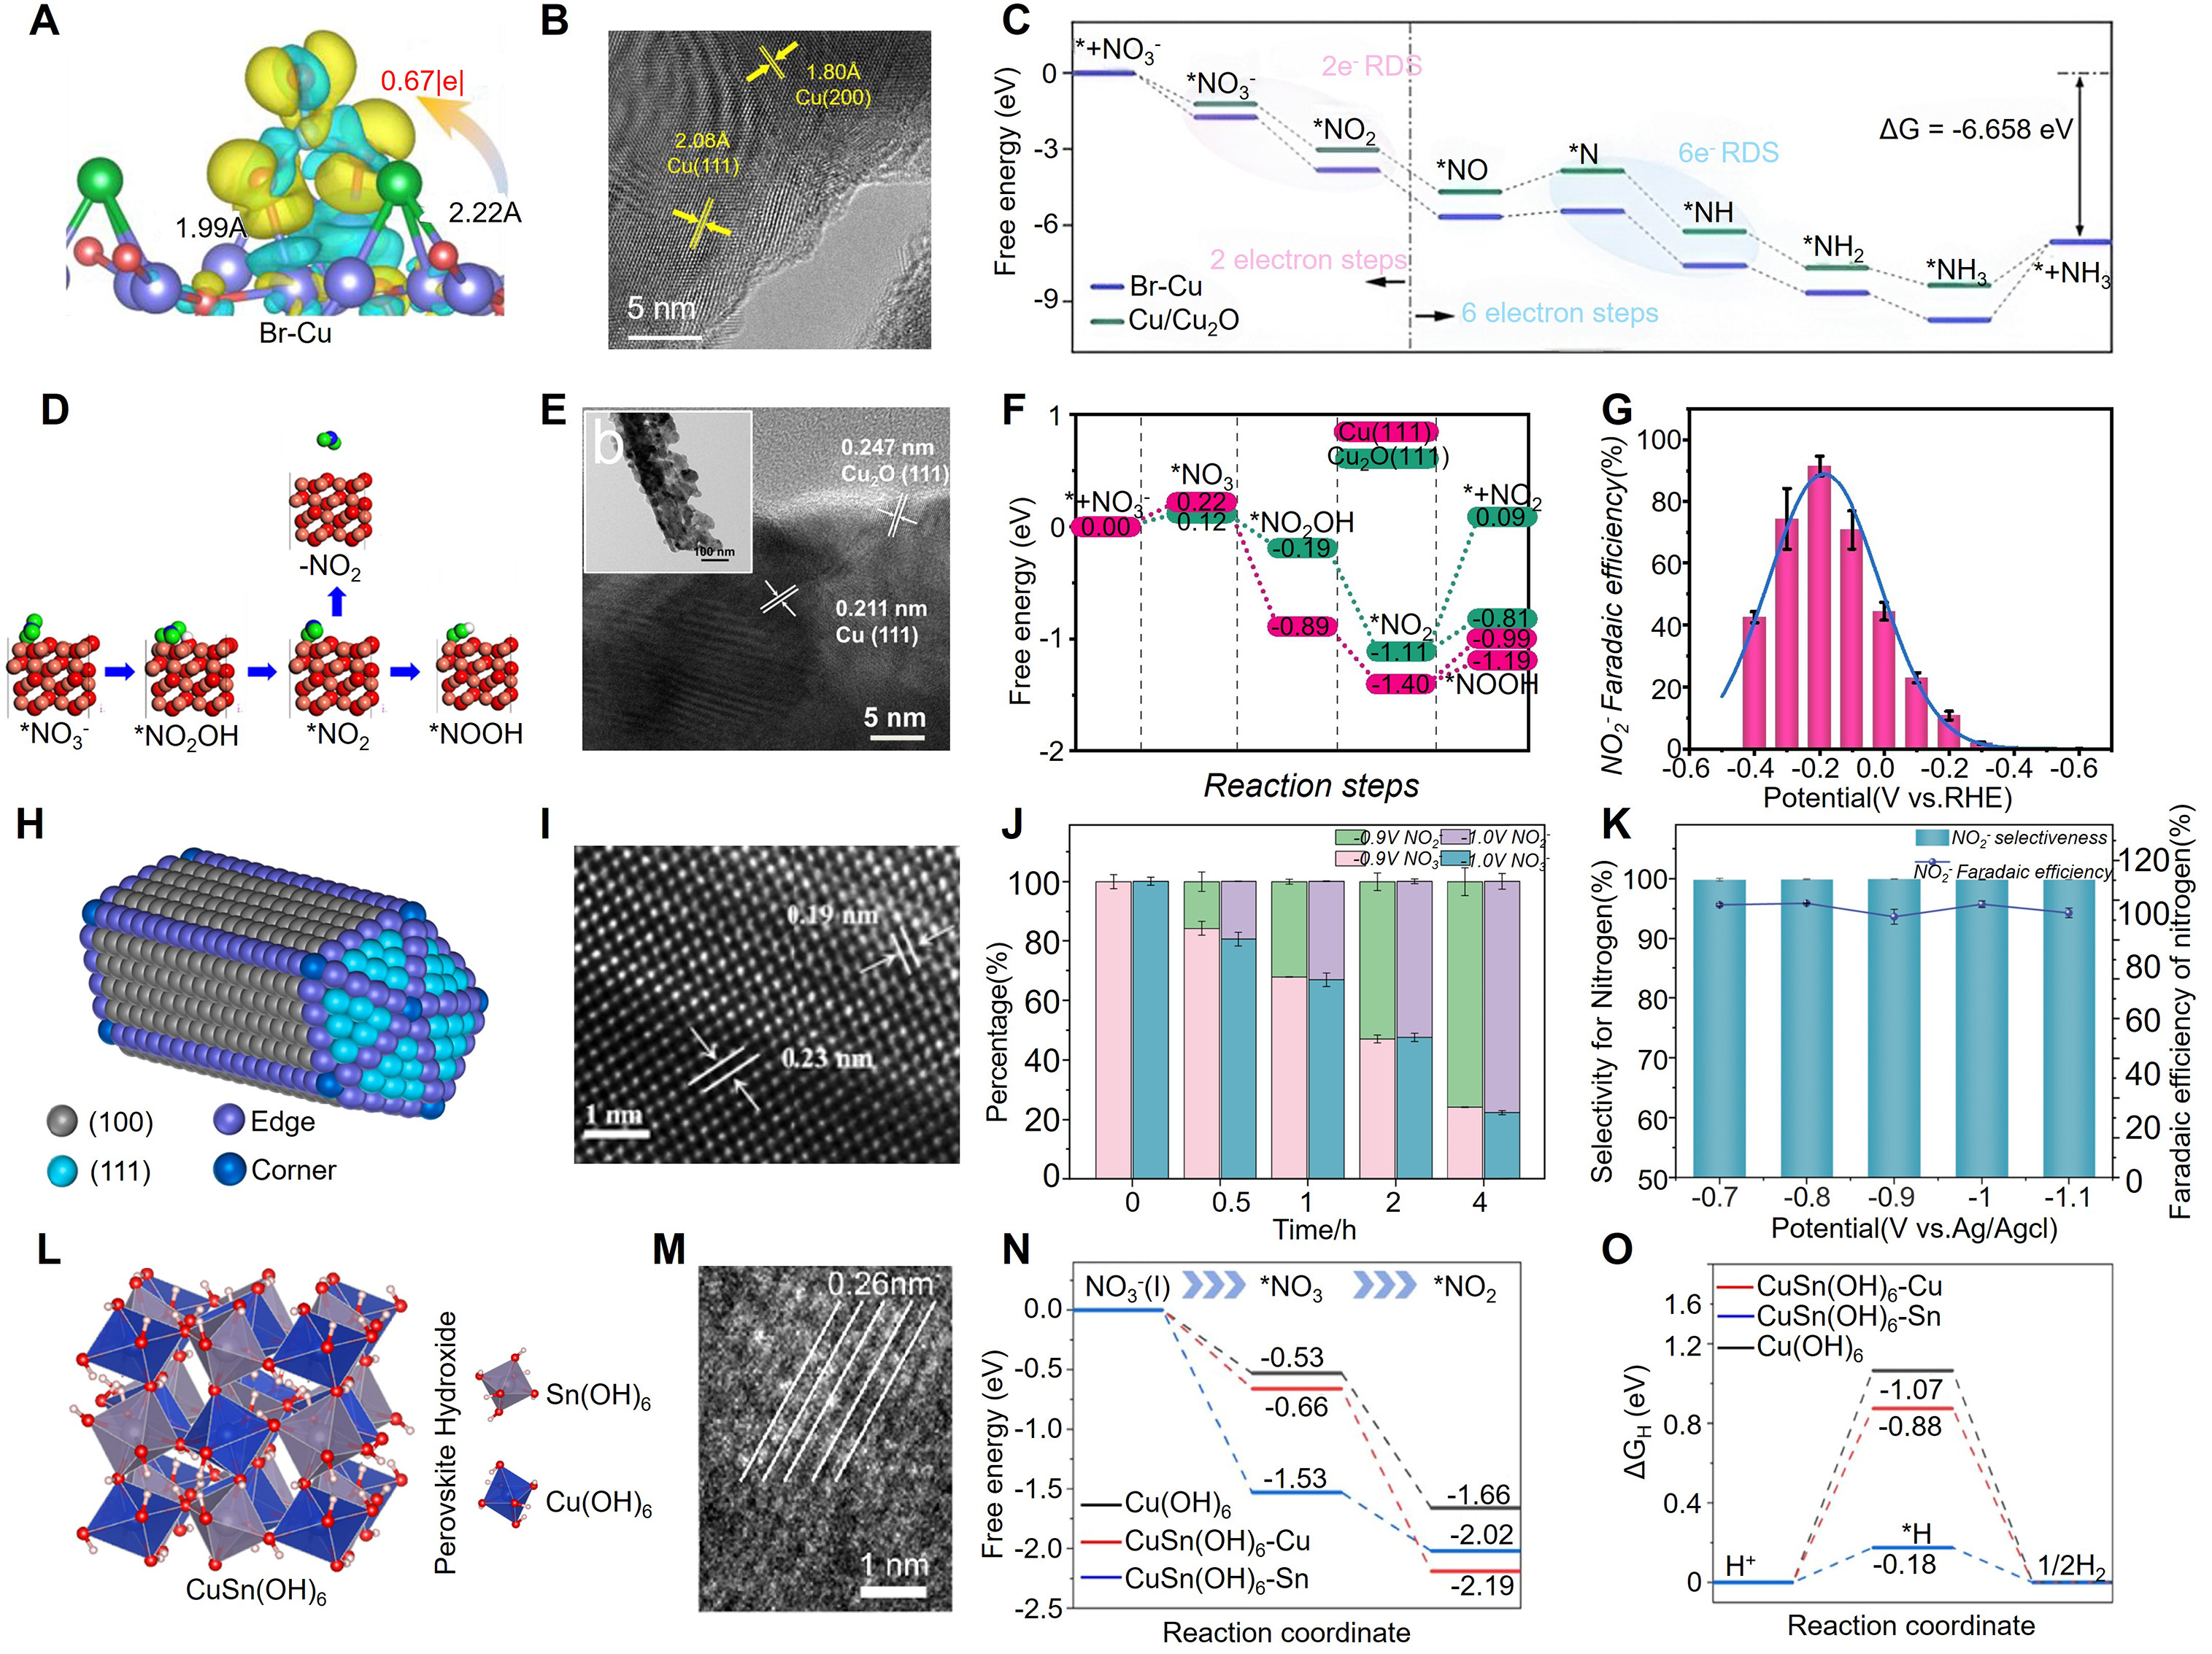
Figure 14. (A) Calculated charge-density-difference map of Br-Cu, showing interfacial charge redistribution and charge transfer. (B) HRTEM image showing lattice fringes assigned to Cu(111) and Cu(200), with spacings of 2.08 and 1.80 Å, respectively. (C) Calculated free-energy profiles for nitrate reduction on Br–Cu and Cu/Cu2O, highlighting the two-electron and six-electron rate-determining steps toward NH3 formation. (A-C) is reprinted with permission from Ref.[277]. Copyright ©2023 Springer Nature. (D) Atomistic structure scheme showing the reaction pathway for electrochemical reduction of NO3- to NO2- on the Cu2O (111) lattice plane. (E) Morphology characterization of Cu-RD-PBS, including TEM and HRTEM images. (F) Comparison of the free-energy diagrams for NO3- reduction over Cu-based surfaces. (G) Faradaic efficiency for the reduction of NO3- to NO2-. (D-G) is reprinted with permission from Ref.[278]. Copyright © 2023 Wiley-VCH GmbH. (H) Structural schematic of Ag nanowires. (I) HRTEM image of Ag nanowires, showing clear lattice fringes. (J) Ratios of nitrate and nitrite at different electrolysis times at - 0.9 and -1.0 V vs. Ag/AgCl. (K) Nitrite selectivity and Faradaic efficiency in the electrolysis of