


fig13
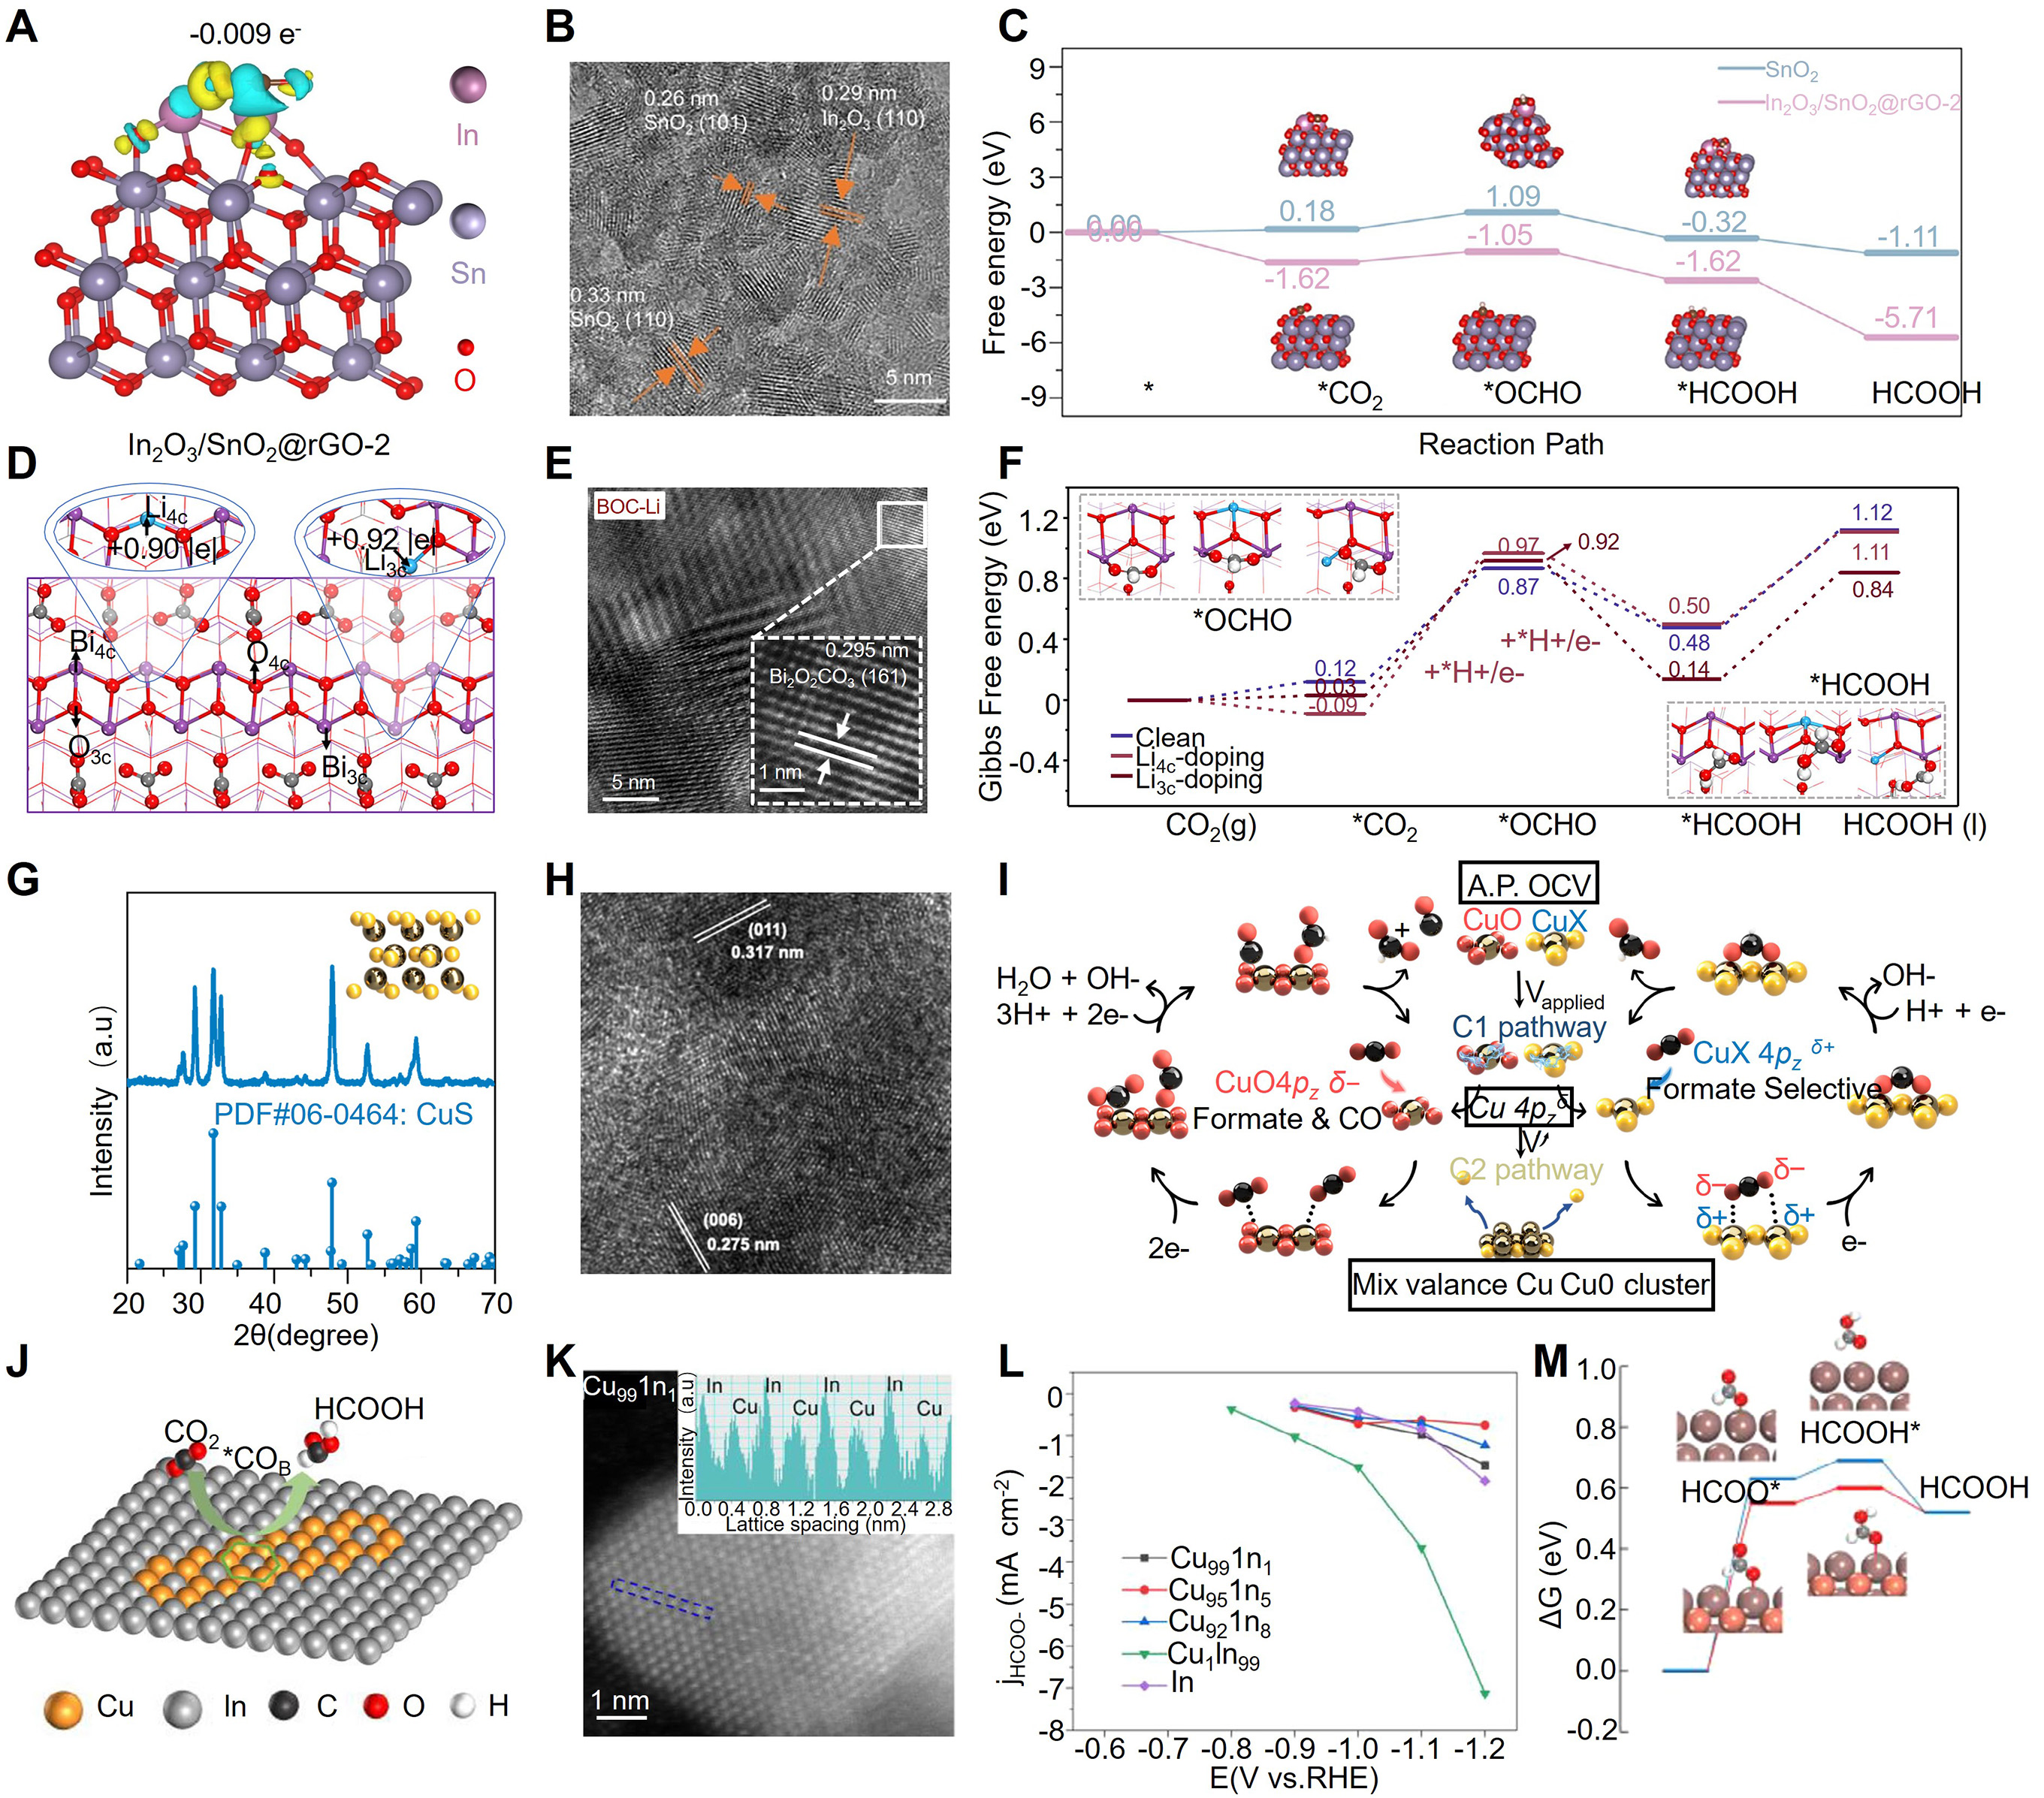
Figure 13. (A) Charge-density diagram of In2O3/SnO2@rGO-2, showing interfacial charge redistribution betweenIn2O3 and SnO2. (B) TEM image of In2O3/SnO2@rGO-2. (C) Gibbs free-energy profile for CO2-to-HCOOH conversion over SnO2@rGO and In2O3/SnO2@rGO-2. (A-C) is reprinted with permission from Ref.[211]. Copyright © 2025 Wiley-VCH GmbH. (D) Structure of the Bi2O2CO3 (161) surface with Li4c and Li3c doping sites and the optimized adsorption structure. (E) HRTEM image of BOC-Li revealing lattice distortions and dislocations. (F) Free-energy diagrams for HCOOH formation via the *OCHO mechanism. Purple, Bi; red, O; white, H; grey, C; light blue, Li. These color notations are used throughout the paper. (D-F) is reprinted with permission from Ref.[212]. Copyright © 2026 Springer Nature (G) XRD pattern of CuS. (H) HR-TEM image of CuS after catalysis at -0.6 V vs. RHE with 85% iR correction. (i, current; R, solution resistance) (I) Proposed carbon dioxide reduction reaction mechanism over copper-based electrocatalysts for multiple reduction products and selective reduction to formate. (G-I) is reprinted with permission from Ref.[210]. Copyright © 2025 Springer Nature. (J) Schematic illustration of CO2 conversion on Cu1In99 catalysts. (K) HAADF-STEM image of the as-prepared Cu1In99 catalyst. The inset shows the line profile for HAADF intensity analysis of the blue dashed region. (L) Partial current densities of HCOO- over Cu99In1, Cu95In5, Cu92In8, Cu1In99, and In catalysts. (M) Comparison of Gibbs free-energy profiles for electrochemical CO2 reduction to HCOOH on In and alloy CuIn under standard hydrogen electrode conditions. Orange, Cu; brown, In; grey, C; white, H; red, O. (J-M) is reprinted with permission from Ref.[270]. Copyright © 2025 Wiley-VCH GmbH.