



fig12
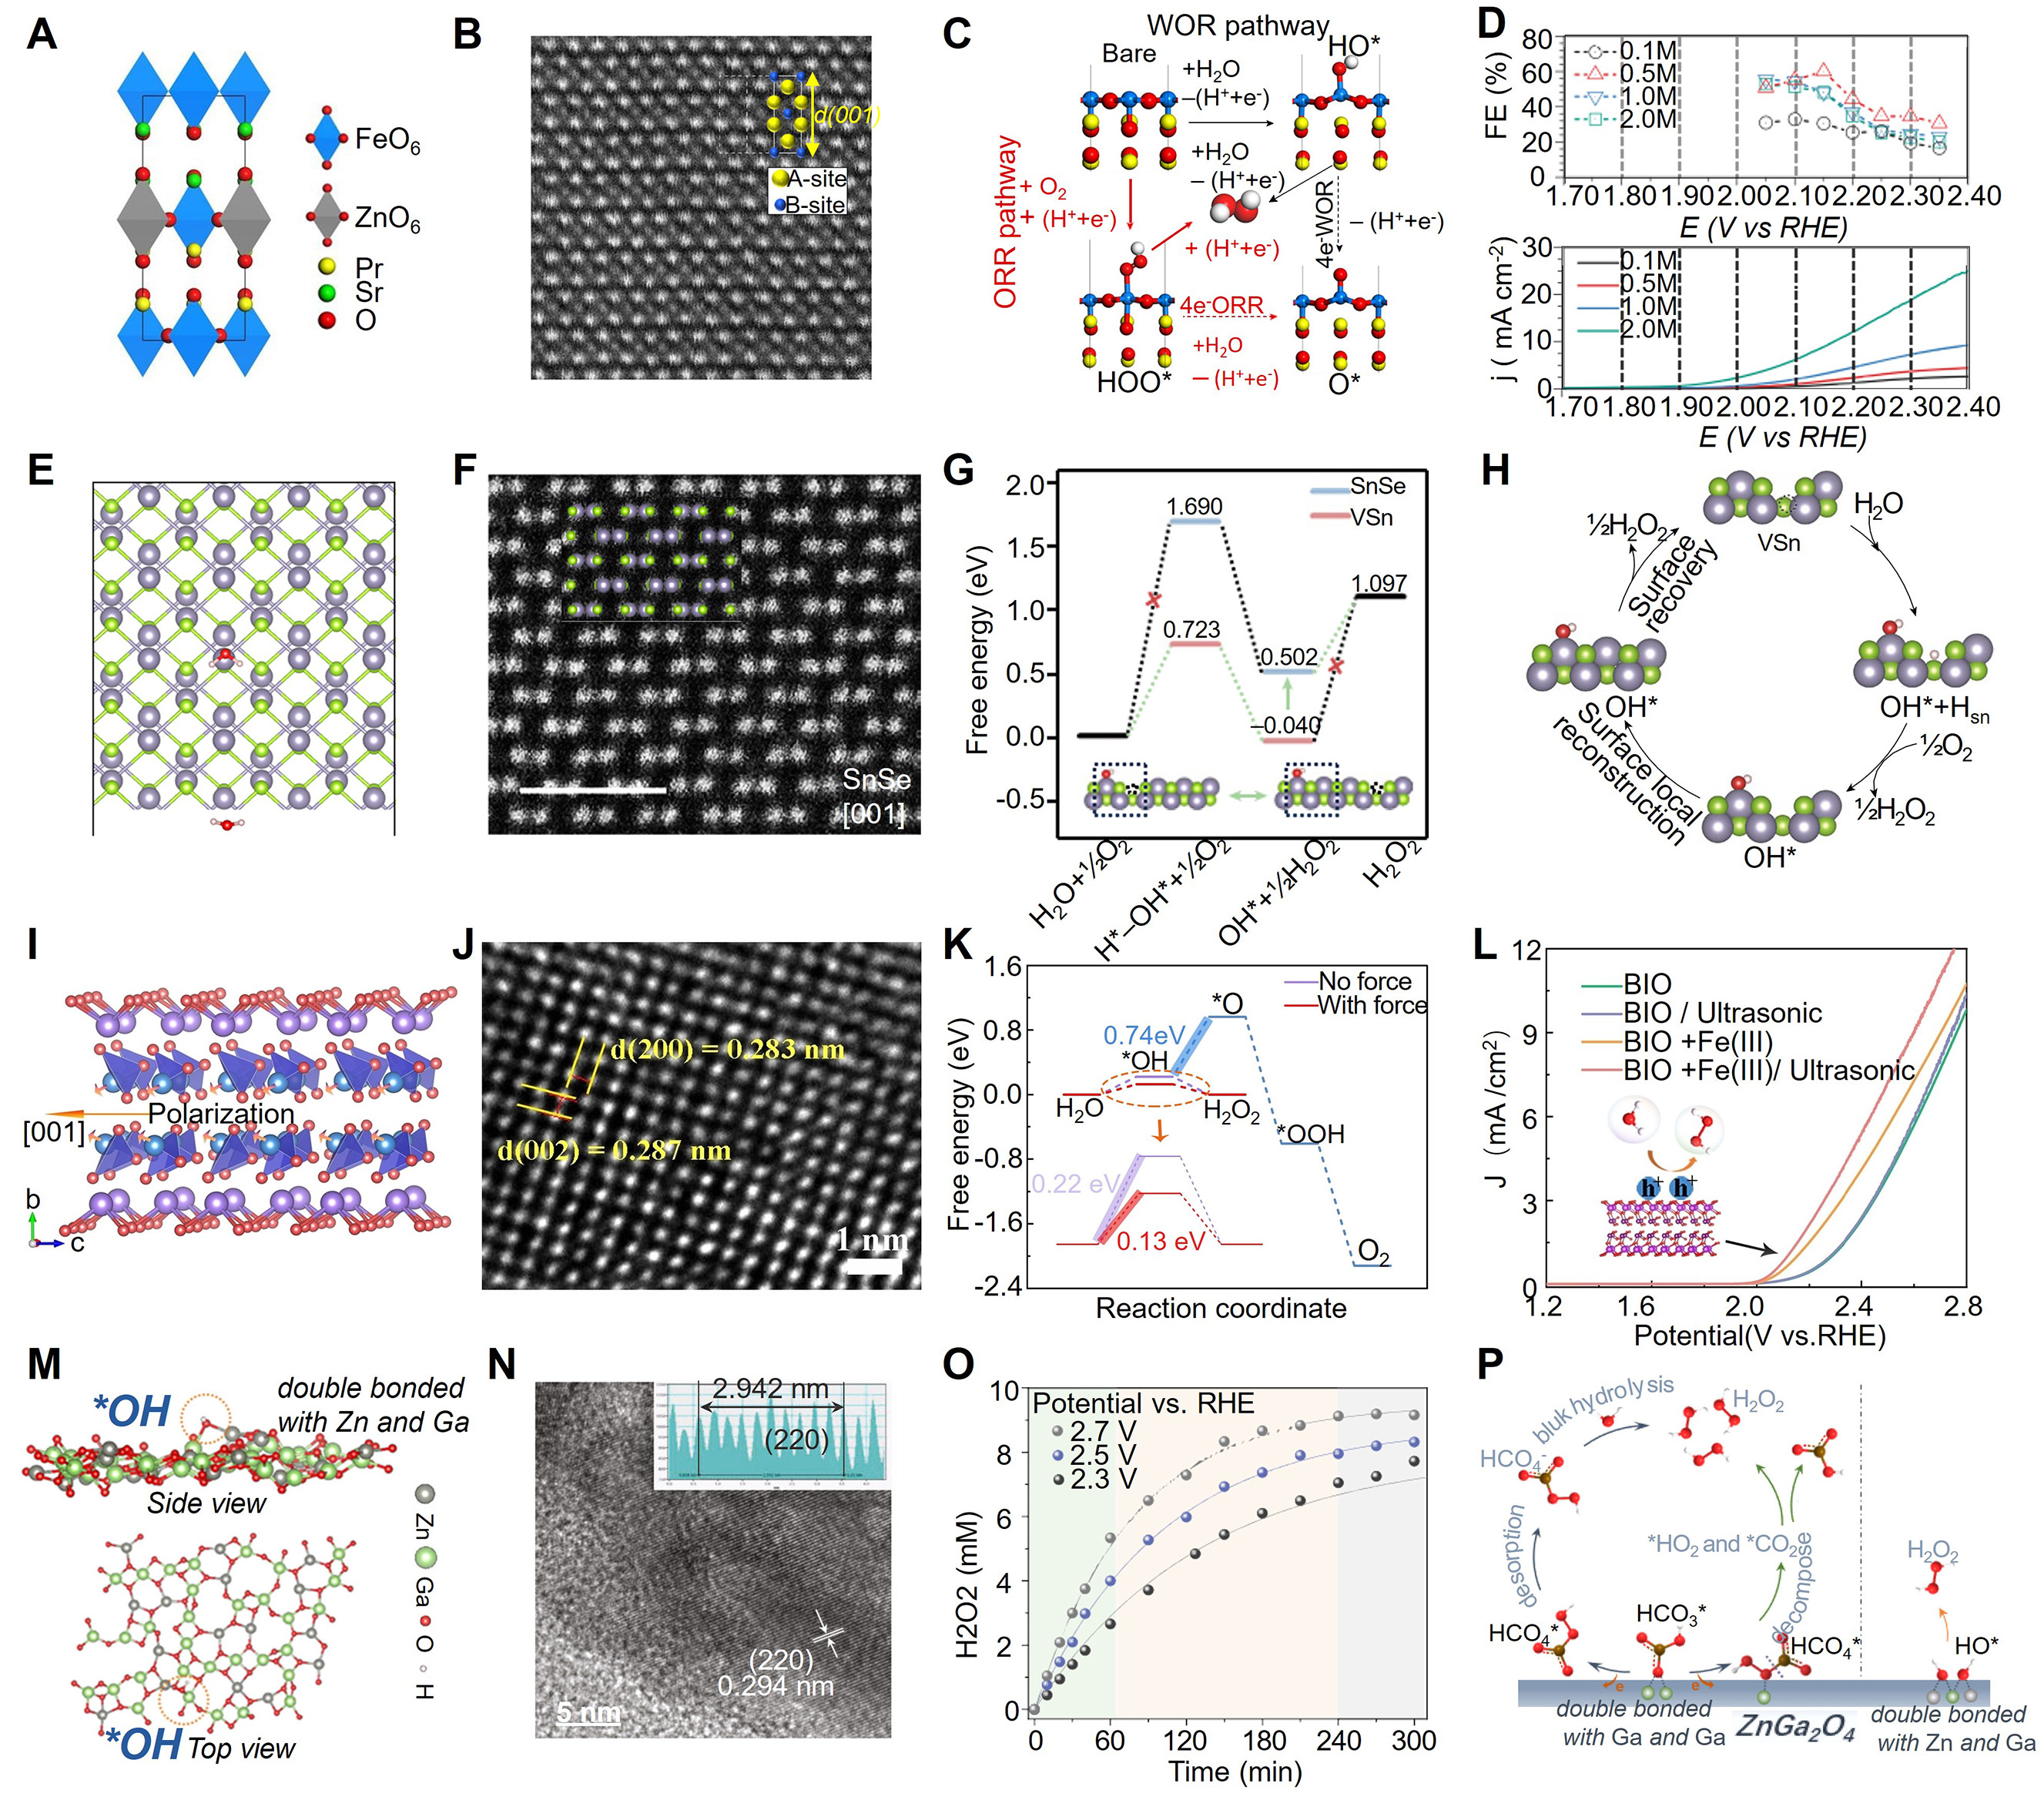
Figure 12. (A) Optimized configurations of RP-PSFZ; blue and gray octahedra represent Fe and Zn sites, while yellow, green, and red spheres represent Pr, Sr, and O atoms, respectively. (B) Atomic-scale HAADF-STEM image of D-PSFZ along the <100> zone axis. (C) Schematic of the H2O2 generation mechanism on the PSF surface through oxygen reduction (red arrow) and water oxidation reaction (black arrow); blue, yellow, red, and white spheres represent Fe, Pr, O, and H atoms, respectively. (D) Water oxidation reaction polarization profiles of D-PSFZ at various solution concentrations of 0.1-2.0 M and saturated KHCO3 solution (lower part) and the corresponding Faradaic efficiencies determined by the titration method (upper part). (A-D) is reprinted with permission from Ref.[256]. Copyright © 2023 Springer Nature. (E) Side views of optimized H2O* and H*-OH* structures on SnSe, VSn, and V2Sn. (F) High-resolution HAADF-STEM image of the SnSe lattice along the [001] axis, with superimposed Sn and Se atoms at each atomic column. (G) Free-energy diagram of H2O2 production; the inset shows local surface reconstruction through VSn migration, where the dashed black circles represent VSn. (H) Schematic diagram of thermocatalytic H2O2 production from H2O and O2 over the surface of SnSe with Sn vacancies. (E-H) is reprinted with permission from Ref.[257]. Copyright © 2025 Springer Nature. (I) Crystal structure of BIO along the b-c planes; red, purple, and blue represent O, Bi, and I atoms, respectively, and orange arrows indicate the polarization direction. (J) Corresponding inverse FFT patterns of BIO. (K) Free-energy diagram for two-electron and four-electron water oxidation reaction. (L) J-V curves of BIO in different systems under positive sweep for H2O oxidation; red and white spheres represent O and H atoms, respectively. (I-L) is reprinted with permission from Ref.[258]. Copyright © 2023 Wiley-VCH GmbH. (M) Side and top views of *OH adsorption on ZnGa2O4. (N) HRTEM image and polycrystalline electron diffraction pattern of ZnGa2O4. (O) Real-timeH2O2 concentration as a function of time at 2.3, 2.5, and 2.7 V vs. RHE; the solid lines are fitting curves. (P) Schematic illustration of the proposed direct and indirect pathways toward H2O2 generation on the ZnGa2O4 surface. (M-P) is reprinted with permission from Ref.[259]. Copyright © 2023 Springer Nature.