



fig10
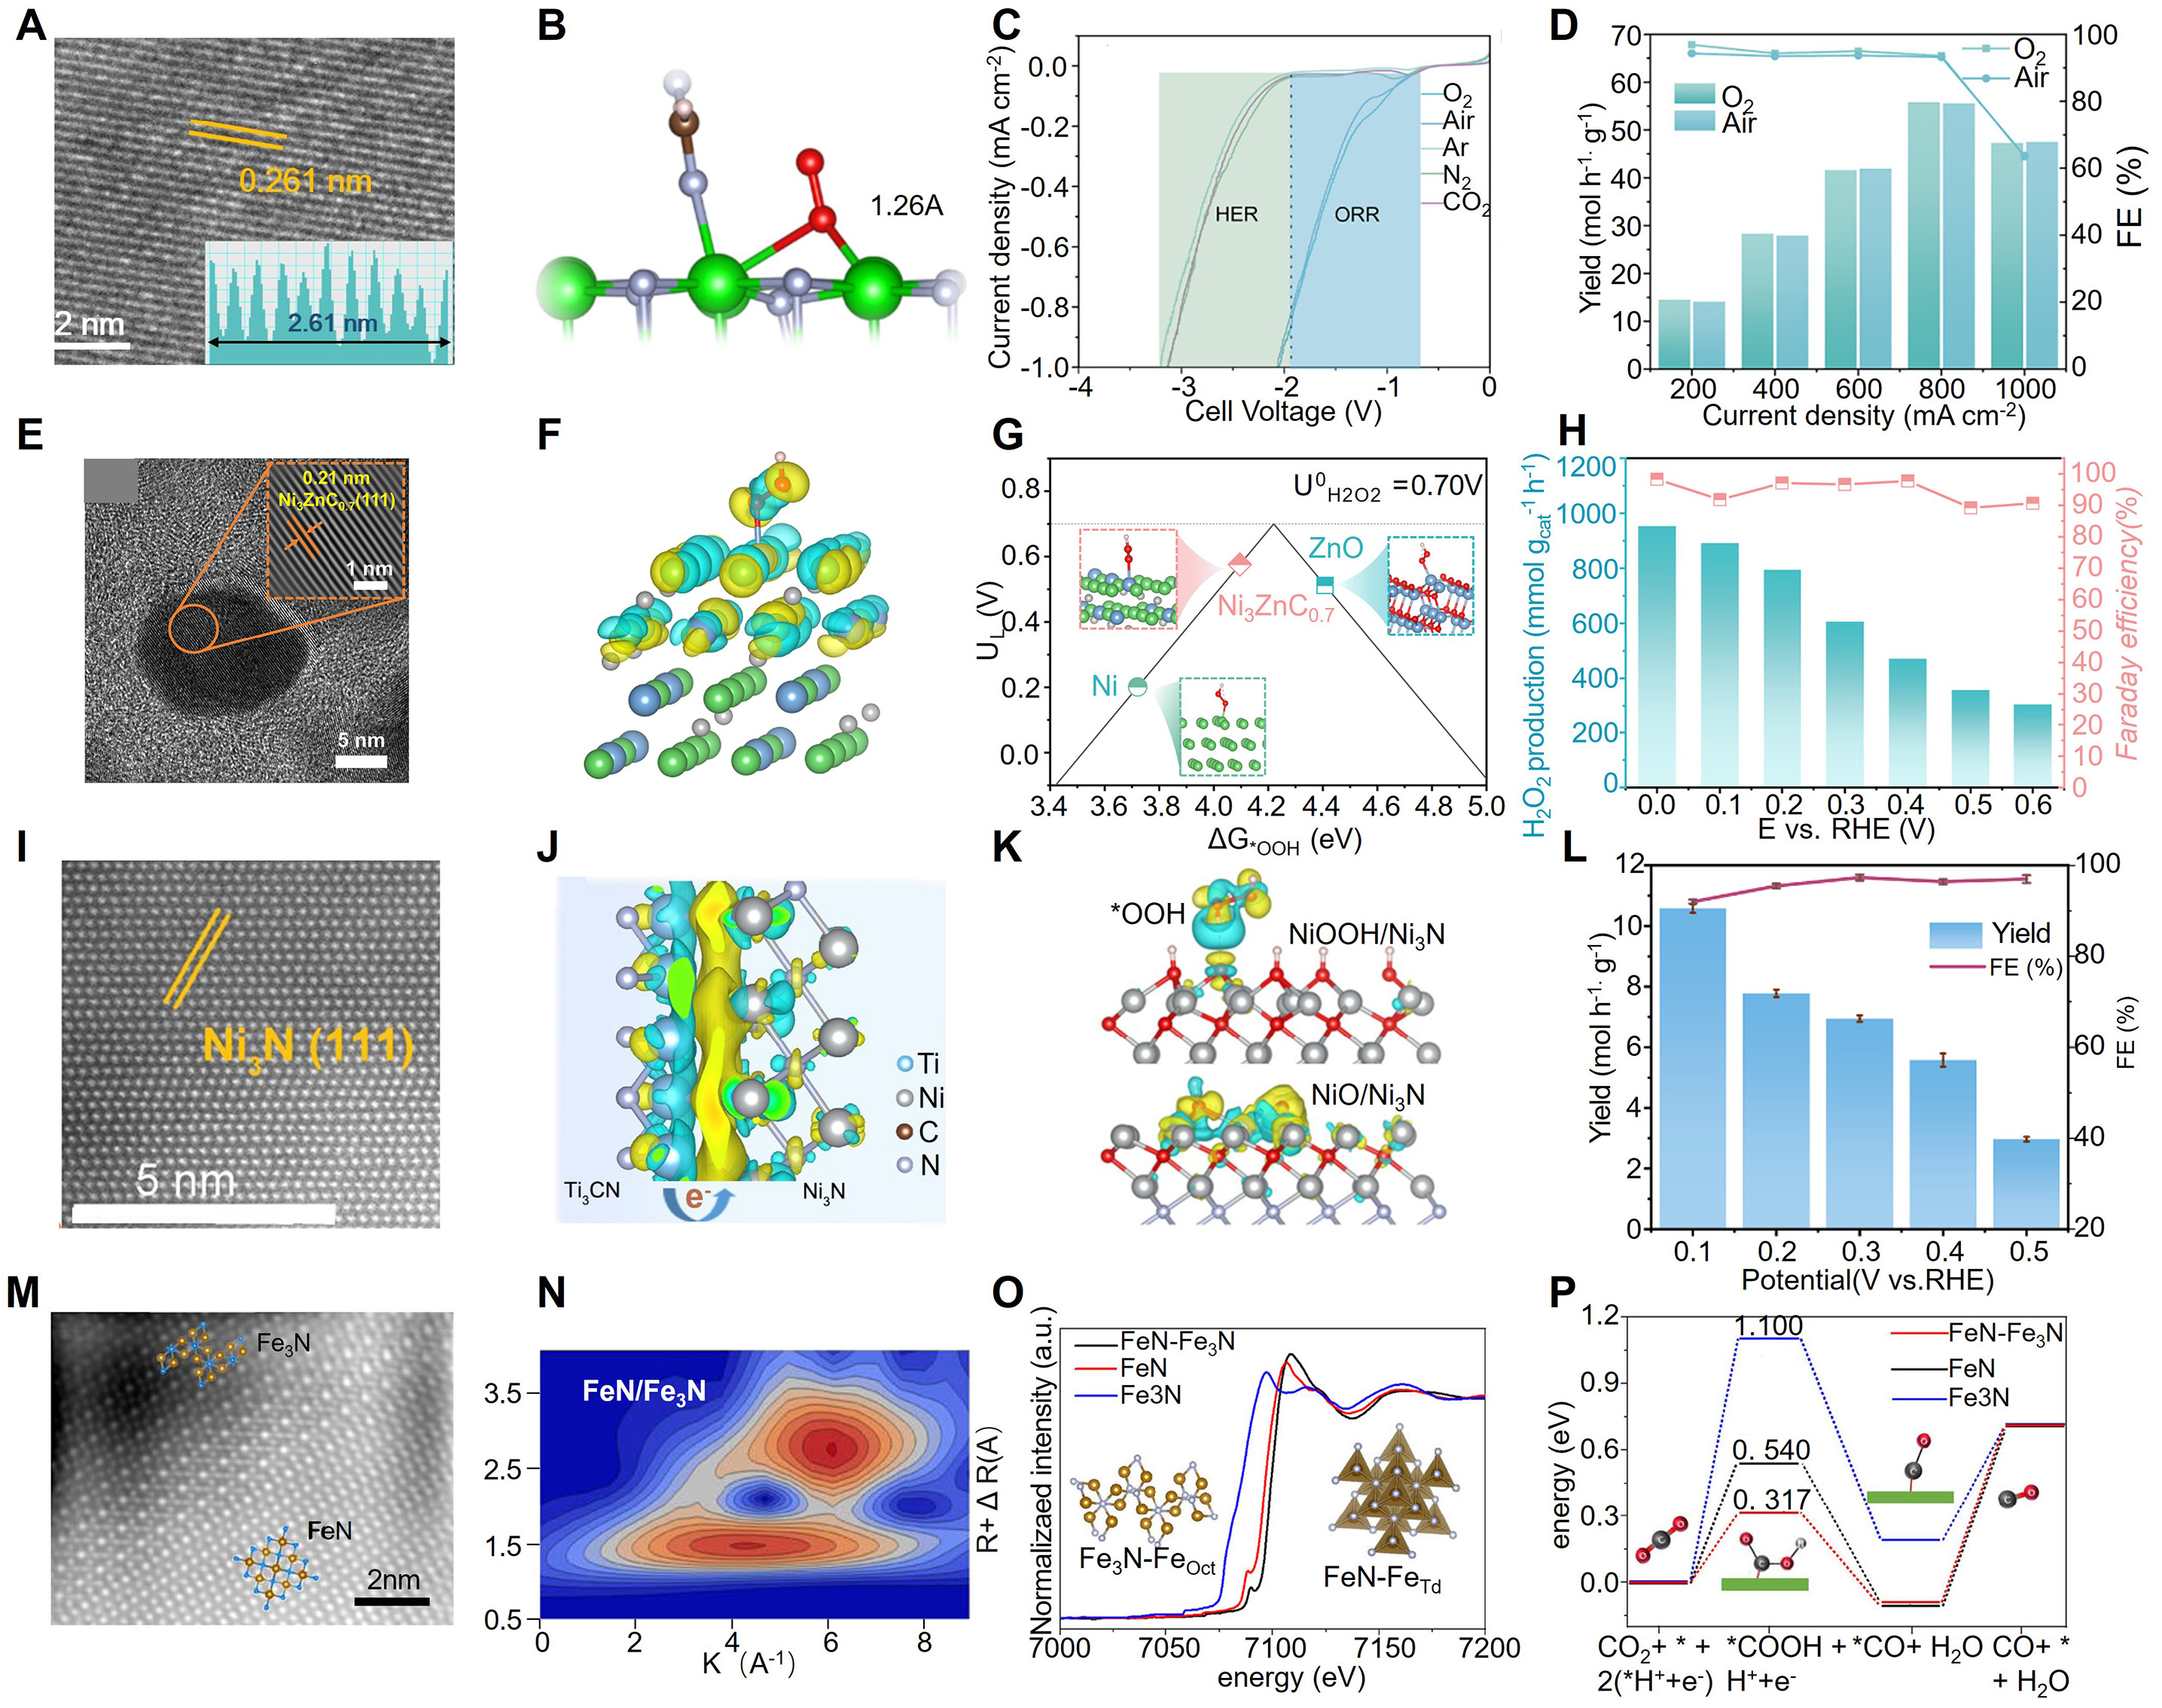
Figure 10. (A) HR-TEM image of T-ZrN. (B) Structural model of the conversion of aqueous O2 on T-ZrN. (C) LSV curves of T-ZrN with O2, air, Ar, N2, or CO2 flowing. (D) H2O2 yield and Faradaic efficiency of T-ZrN under different current densities with O2 or air flowing. (A-D) is reprinted with permission from Ref.[197]. Copyright © 2025 American Chemical Society. (E) HR-TEM image of Ni3ZnC0.7/C. (F) Charge density difference of Ni3ZnC0.7/C (111) with *OOH adsorption, side view. (G) Activity volcano plot for the two-electron oxygen reduction reaction based on *OOH adsorption free energy. (H) H2O2 yield rate and Faradaic efficiency of Ni3ZnC0.7/C at the corresponding potentials. (E-H) is reprinted with permission from Ref.[198]. Copyright © 2026 Elsevier B.V. (I) HR-TEM images of Ni3N/MX. (J) Charge density distribution of Ni3N/Ti3CN. (K) Disparity in charge distribution between *OOH on NiOOH/Ni3N and NiO/Ni3N. (L) H2O2 yield and Faradaic efficiency of Ni3N/MX under O2 flowing at different potentials; the test time under each potential is 1 h. (I-L) is reprinted with permission from Ref.[199]. Copyright © 2025 Elsevier B.V. (M) HRHAADF-STEM image of the FeN/Fe3N interface. (N) Wavelet transforms for the k3-weighted EXAFS signals of FeN/Fe3N. (O) Normalized Fe K-edge EXAFS spectra; inset: the local FeN structure showing tetrahedral coordination and the Fe3N structure showing octahedral coordination. (P) Calculated Gibbs free-energy diagrams for carbon dioxide reduction reaction on FeN, Fe3N, and FeN/Fe3N surfaces. (M-P) is reprinted with permission from Ref.[200]. Copyright © 2023 Springer Nature.