



Thermally induced urea-assisted porous precursor film for efficient planar inverted water-based perovskite solar cells
 0
0 
Abstract
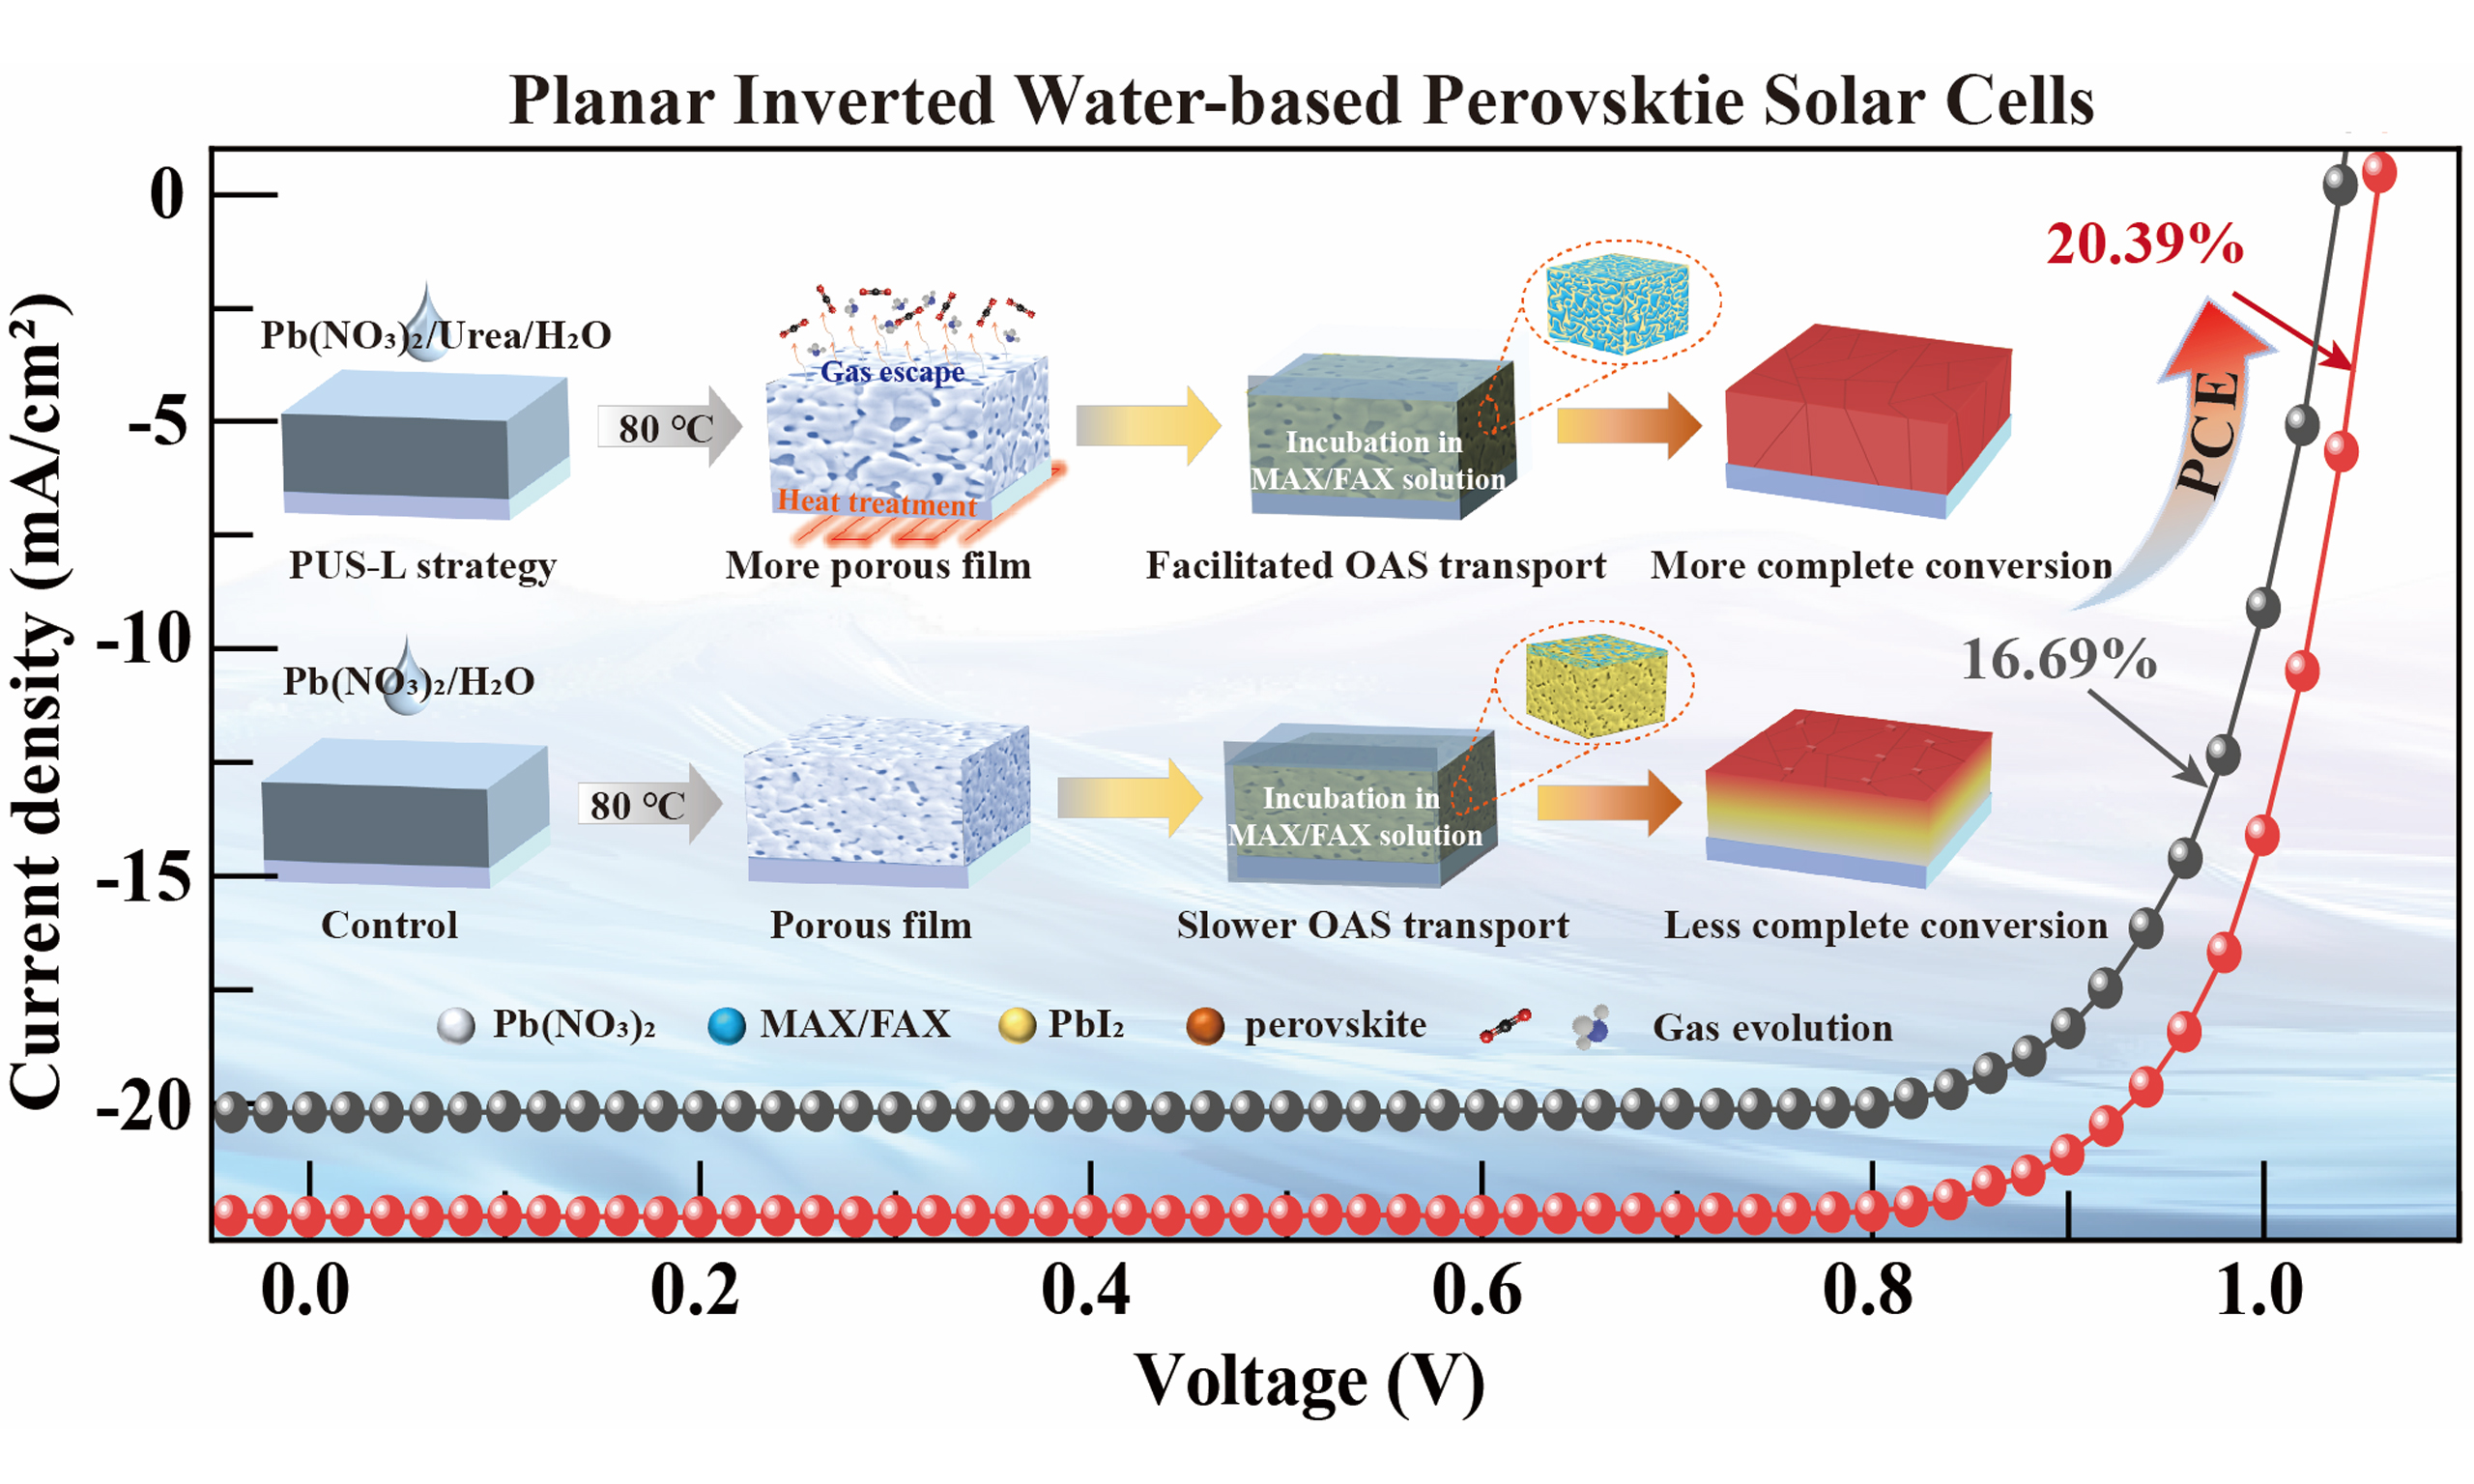
Planar inverted water-based perovskite solar cells (PIW-PSCs) can be fabricated without toxic organic solvents. However, in the aqueous deposition route, organic ammonium salts (OAS) must penetrate the precursor film while simultaneously driving phase conversion. This deposition method results in slow and nonuniform conversion. Here, urea is used as a water-compatible additive that improves precursor wetting and promotes further development of the internal porous structure by the subsequent thermal treatment. The resulting porous precursor provides more accessible transport pathways for OAS, thereby promoting more complete conversion of Pb(NO3)2 into perovskite. Consequently, the resulting perovskite film exhibits enlarged grains, reduced defect density, and reduced residual compressive stress. The corresponding PIW-PSC achieves a champion power conversion efficiency (PCE) of 20.39%, while the PIW-PSC device shows stable power output for 20 min at a fixed bias corresponding to its maximum-power-point voltage. Unencapsulated PUS-L devices retain 84% of their initial PCE after approximately
Keywords
INTRODUCTION
Planar inverted perovskite solar cells (PI-PSCs) have attracted considerable interest owing to their high efficiency, compatibility with flexible substrates, and suitability for tandem device architectures[1-4]. However, their fabrication still relies heavily on toxic polar organic solvents[5,6]. Developing greener processing routes is therefore important for the sustainable development of PI-PSCs.
Water is an attractive processing solvent because of its low toxicity, widespread availability, and low cost. In 2015, Hsieh et al. introduced a sequential deposition route using an aqueous Pb(NO3)2 precursor for the fabrication of water-based PSCs[7]. In this process, a Pb(NO3)2 precursor film is first deposited from water and subsequently immersed in an organic ammonium salt (OAS) solution to induce ion exchange and perovskite formation. Although this route avoids the use of hazardous polar organic solvents, the conversion of Pb(NO3)2 into the perovskite phase is kinetically slow and can lead to incomplete or nonuniform conversion[8,9]. Therefore, several strategies, including the incorporation of functional additives, light-assisted treatment, and multiple-cycle immersion, have been explored to accelerate the conversion of Pb(NO3)2 into perovskite[10-13]. These strategies have increased the reported power conversion efficiency (PCE) of water-based PSCs to 24.14%[14]. Nevertheless, currently reported high-efficiency water-based PSCs mainly adopt the planar normal structure (PNW-PSCs), while the efficiencies of water-based PI-PSCs [planar inverted water-based perovskite solar cells (PIW-PSCs)] remain far lower than those of the PNW-PSCs. Therefore, effective strategies to enhance the efficiency of PIW-PSCs are urgently needed to address the performance shortfall of this device architecture. Dai et al. employed a heating-assisted strategy to accelerate the conversion by reducing the chemical reaction barrier and the nucleation free energy from the precursor to perovskite, while achieving a PCE of 16.20% for PIW-PSCs[15]. Furthermore, they investigated the influence of substrate surface properties on precursor film deposition, and by thermally assisted reconstruction of the substrate surface, they successfully fabricated the PIW-PSCs with an efficiency of 18.34%[16]. Despite this progress, an effective strategy for addressing the slow conversion kinetics of PIW-PSCs is still needed.
Further analysis of the conversion from Pb(NO3)2 to perovskite reveals a key distinction from conventional PbI2-based sequential deposition. In the PbI2-based system, the lead precursor is already halide-based, whereas the aqueous Pb(NO3)2 route requires OAS penetration to proceed concurrently with nitrate-to-halide exchange and the formation of PbI2 or halide-rich intermediates before the perovskite is fully established[8,11,15]. As the conversion proceeds from the surface toward the film interior, the newly formed halide-rich or perovskite-rich layer can increasingly restrict inward OAS transport, resulting in slow and spatially nonuniform conversion. In conventional PbI2-based sequential deposition, precursor permeability can be regulated through solvent or additive engineering, Lewis-base coordination, and porous or loosely packed PbI2 structures[17-19]. Many of these approaches are not directly transferable to a fully aqueous Pb(NO3)2 precursor. Therefore, a water-compatible approach to regulating precursor-film permeability is required.
Urea has previously been employed as a pore-forming or sacrificial agent in polymer and ceramic materials[20,21]. Therefore, the novelty of this work does not arise from the use of urea as a porogen itself, but from adapting its functions to the aqueous Pb(NO3)2 precursor system. In this system, urea is water-compatible, interacts with Pb2+, and improves precursor-solution wetting, while the subsequent heat treatment promotes the development of internal porosity without altering the Pb(NO3)2 phase. The resulting porous precursor facilitates OAS transport during the coupled nitrate-to-halide exchange and perovskite formation, thereby addressing the transport limitation characteristic of the aqueous Pb(NO3)2 route. With this strategy, the optimized PIW-PSC reaches a champion PCE of 20.39% and exhibits improved thermal-aging and ambient-storage stability.
EXPERIMENTAL
Materials
Nickel oxide (NiOx, 99.5%) nanopowder, formamidinium iodide [CH(NH2)2I, FAI, 99.5%], and indium tin oxide (ITO) glass with a resistance of ~15 Ω/□ were purchased from Advanced Electron Technology Co., Ltd. (China). [6,6]-Phenyl C61-butyric acid methyl ester (PC61BM, 99.5%), methylammonium iodide (CH3NH3I, MAI, 99.5%), bathocuproine (BCP, 99.0%), poly[bis(4-phenyl) (2,4,6-trimethylphenyl) amine] (PTAA, Mn = 6,000-15,000, > 99%) and methylammonium chloride (MACl, 99.5%) were produced by Xi’an Yuri Solar Co., Ltd. (China). Lead(II) nitrate [Pb(NO3)2, 99.99%], urea (99%), potassium bromide (KBr, 99%) and isopropyl alcohol (IPA, 99.8%) were purchased from Aladdin (China). Chlorobenzene (CB, 99.8%, ultradry) was purchased from MERYER (China). Gold (Au, 99.999%) and silver (Ag, 99.999%) were produced by Hefei Xinyu New Materials Technology Co., Ltd. Detergent was produced by Decon Laboratories Limited (DECON 90, UK).
Porous precursor film fabrication
The ITO substrates were sequentially ultrasonically cleaned with DECON 90 detergent and deionized H2O
Characterization methods
The interaction between urea and Pb(NO3)2 was characterized by Fourier transform infrared (FTIR) spectroscopy (PerkinElmer, Spectrum Two, USA). For FTIR measurements, dried urea and Pb(NO3)2 powders were ground with KBr, and measured in transmission mode over 4,000-400 cm-1 with 10 accumulated scans at 30%-40% RH. Surface tension of the precursor solutions was measured using an automatic tensiometer (Swedish Biolin Company, Sigma 700, Sweden) via the maximum bubble pressure method. The thermal behaviors of bulk urea and Pb(NO3)2 were measured separately using a synchronous thermal analyzer (TGA, PerkinElmer, STA8000, USA) from room temperature to 800 °C at a heating rate of 5 °C min-1 under dry air. The gaseous products evolved during urea heating were further analyzed by thermogravimetry-mass spectrometry (TG-MS, HITACHI STA7300, Japan) under dry air (N2/O2 mixture) at a heating rate of 10 °C min-1. The mass signals at m/z = 17, 18, and 44 were extracted for analysis. The surface and cross-sectional morphologies of the films were examined using scanning electron microscopy (SEM, JEOL, JSM-7800F, Japan) in secondary electron imaging mode. Accelerating voltages of 10.0 and 5.0 kV were used for surface and cross-sectional imaging, respectively. The crystalline phases of the precursor and perovskite films were identified via X-ray diffraction (XRD, SHIMADZU, XRD-7000, Japan) employing Cu Kα radiation (40 kV, 30 mA). Diffraction patterns were acquired in continuous scan mode with a step size of 0.02° and a scan rate of 5° min-1. Time-dependent XRD measurements were performed on the same perovskite film. The film was successively annealed at 150 °C in 6 s intervals and characterized after each interval until the characteristic diffraction peak of δ-FAPbI3 disappeared. The reported times correspond to the cumulative annealing duration. Optical absorption characteristics of the perovskite films were recorded using a ultraviolet-visible (UV-Vis) spectrophotometer (Hitachi, UH4150, Japan) in both transmission and absorption modes. For the in situ UV-Vis measurements, the precursor films were incubated in the OAS solution at 50 °C, and the spectra were recorded over 450 s to monitor the conversion process. The absorbance at 700 nm was extracted from the same spectra for the kinetic analysis. The 450 s measurement was used to follow the conversion kinetics, whereas the optimized incubation time of 2 min was used for device fabrication. Steady-state photoluminescence (PL) measurements were performed on perovskite films deposited on quartz and quartz/NiOx substrates, while time-resolved photoluminescence (TRPL) measurements were conducted on quartz/NiOx/perovskite samples. Both measurements were carried out using a fluorescence spectrometer (Edinburgh Instruments, FLS1000, UK) with a 465 nm excitation source. The PL measurements and data analysis were supported by Zhongke e-Test Research Service. Photovoltaic performance was measured using a source meter (Keithley, Model 2400, USA) under simulated AM 1.5G illumination (100 mW/cm2) provided by a solar simulator (Newport, Model 94043A, USA). The illumination intensity was calibrated using a standard silicon cell before measurement. All J-V measurements were performed in a nitrogen-filled glovebox without an aperture mask. The J-V curves were recorded between -0.2 and 1.2 V in both scan directions using a voltage step of 0.02 V, with no additional delay between voltage steps. The device active area was 0.0625 cm2. For stabilized-output measurements, the devices were continuously illuminated under AM 1.5G conditions and held at fixed bias voltages corresponding to the maximum-power-point voltages determined from their J-V curves. The applied voltages were 0.8 V for the control and 0.9 V for both PU-L and PUS-L, and the output was recorded for 20 min. The batch-resolved photovoltaic statistics were obtained from three independent fabrication batches prepared on different days. All devices used for stability measurements were unencapsulated. Thermal aging was performed under N2 at 80 °C, while ambient storage was conducted at approximately 25 °C and 30%-35% RH. External quantum efficiency (EQE) spectra were derived by measuring the photocurrent and corresponding light intensity under monochromatic illumination using a lock-in amplifier (Newport, SR-830, USA) for signal acquisition. Transient photocurrent (TPC) and transient photovoltage (TPV) measurements were performed using a transient-response system consisting of a nanosecond pulsed laser (Polaris II, New Wave Research, USA;
where E (11.1 GPa) and ν (0.30) are the Young’s modulus and Poisson’s ratio of α-FAPbI3[23], respectively, θ0 is the Bragg angle, and
RESULTS AND DISCUSSION
To clarify how urea modifies the aqueous Pb(NO3)2 precursor, we first examined the physicochemical properties of the precursor system. FTIR spectra [Figure 1A and B] show that, compared to pure urea and Pb(NO3)2, the characteristic bands of Pb(NO3)2@urea show clear shifts relative to those of the individual components. The changes in the C=O stretching vibration and C-N/N-H related vibrations confirm that the C=O and -NH2 groups of urea coordinate with Pb2+[24,25], thereby enabling control over the physicochemical properties of the precursor solution and the crystallization kinetics of the lead source. The surface tension of the Pb(NO3)2 solution is higher than that of pure water [Figure 1C]. This is because the negative adsorption effect induced by Pb2+ outweighs the positive contribution of NO3-, leading to an increase in surface tension[26]. After introducing urea, the surface tension of the solution reduces from 72.20 to 68.78 mN/m. The reason is that urea not only acts as a water structure breaker to disrupt the hydrogen-bonding network of water but also coordinates with Pb2+ to weaken the negative adsorption capacity of Pb2+, leading to the positive adsorption behavior of solutes dominating[27]. The lower surface tension favors spreading of the precursor solution on the substrate[28]. Contact angle measurements [Figure 1D] further confirm that the introduction of urea reduces the solution’s contact angle on the NiOx substrate from 9.61° to 6.33°, demonstrating a marked improvement in wettability. To examine the thermal behavior of the individual components, TGA measurements were performed on bulk urea and Pb(NO3)2 under dry-air conditions [Figure 1E]. Under these conditions, urea shows little mass loss below approximately 133 °C and subsequently undergoes multistep thermal decomposition[29,30]. It should be noted that this temperature reflects the behavior of bulk urea under the TGA conditions and does not represent the exact decomposition onset of urea within the aqueous-derived Pb(NO3)2/urea matrix. The matrix-specific onset temperature was not directly determined in the present study. A possible contribution from residual moisture at lower temperatures cannot be excluded, but a specific decomposition onset is not assigned without direct evidence from the Pb(NO3)2/urea matrix. To further identify the gaseous species evolved during urea heating, TG-MS measurements were performed under dry air [Figure 1F and Supplementary Figure 1A]. The m/z = 44 and 18 signals are assigned to CO2 and H2O, respectively. The m/z = 17 signal increases markedly during the main decomposition stage and is mainly associated with NH3 evolution. Because H2O can also contribute to m/z = 17, the relatively high signal at the beginning of the measurement is not assigned solely to NH3. A weak CO2-related signal is detectable at relatively low temperature, followed by more pronounced gas evolution during the subsequent decomposition process. At higher temperatures, a further CO2 evolution feature accompanied by a weak H2O signal is observed. These results provide direct evidence for gas evolution during the multistep thermal transformation of urea. The FTIR spectrum of urea also changes after heat treatment [Supplementary Figure 1B], further supporting the thermally induced chemical transformation of urea. In contrast, Pb(NO3)2 begins to decompose only above approximately 200 °C. XRD measurements further show that the Pb(NO3)2 phase is retained after the heat treatment [Supplementary Figure 2]. Therefore, 150 °C was selected as the additional treatment temperature while preserving the Pb(NO3)2 precursor phase. The thermal decomposition pathway is illustrated in Figure 1G.
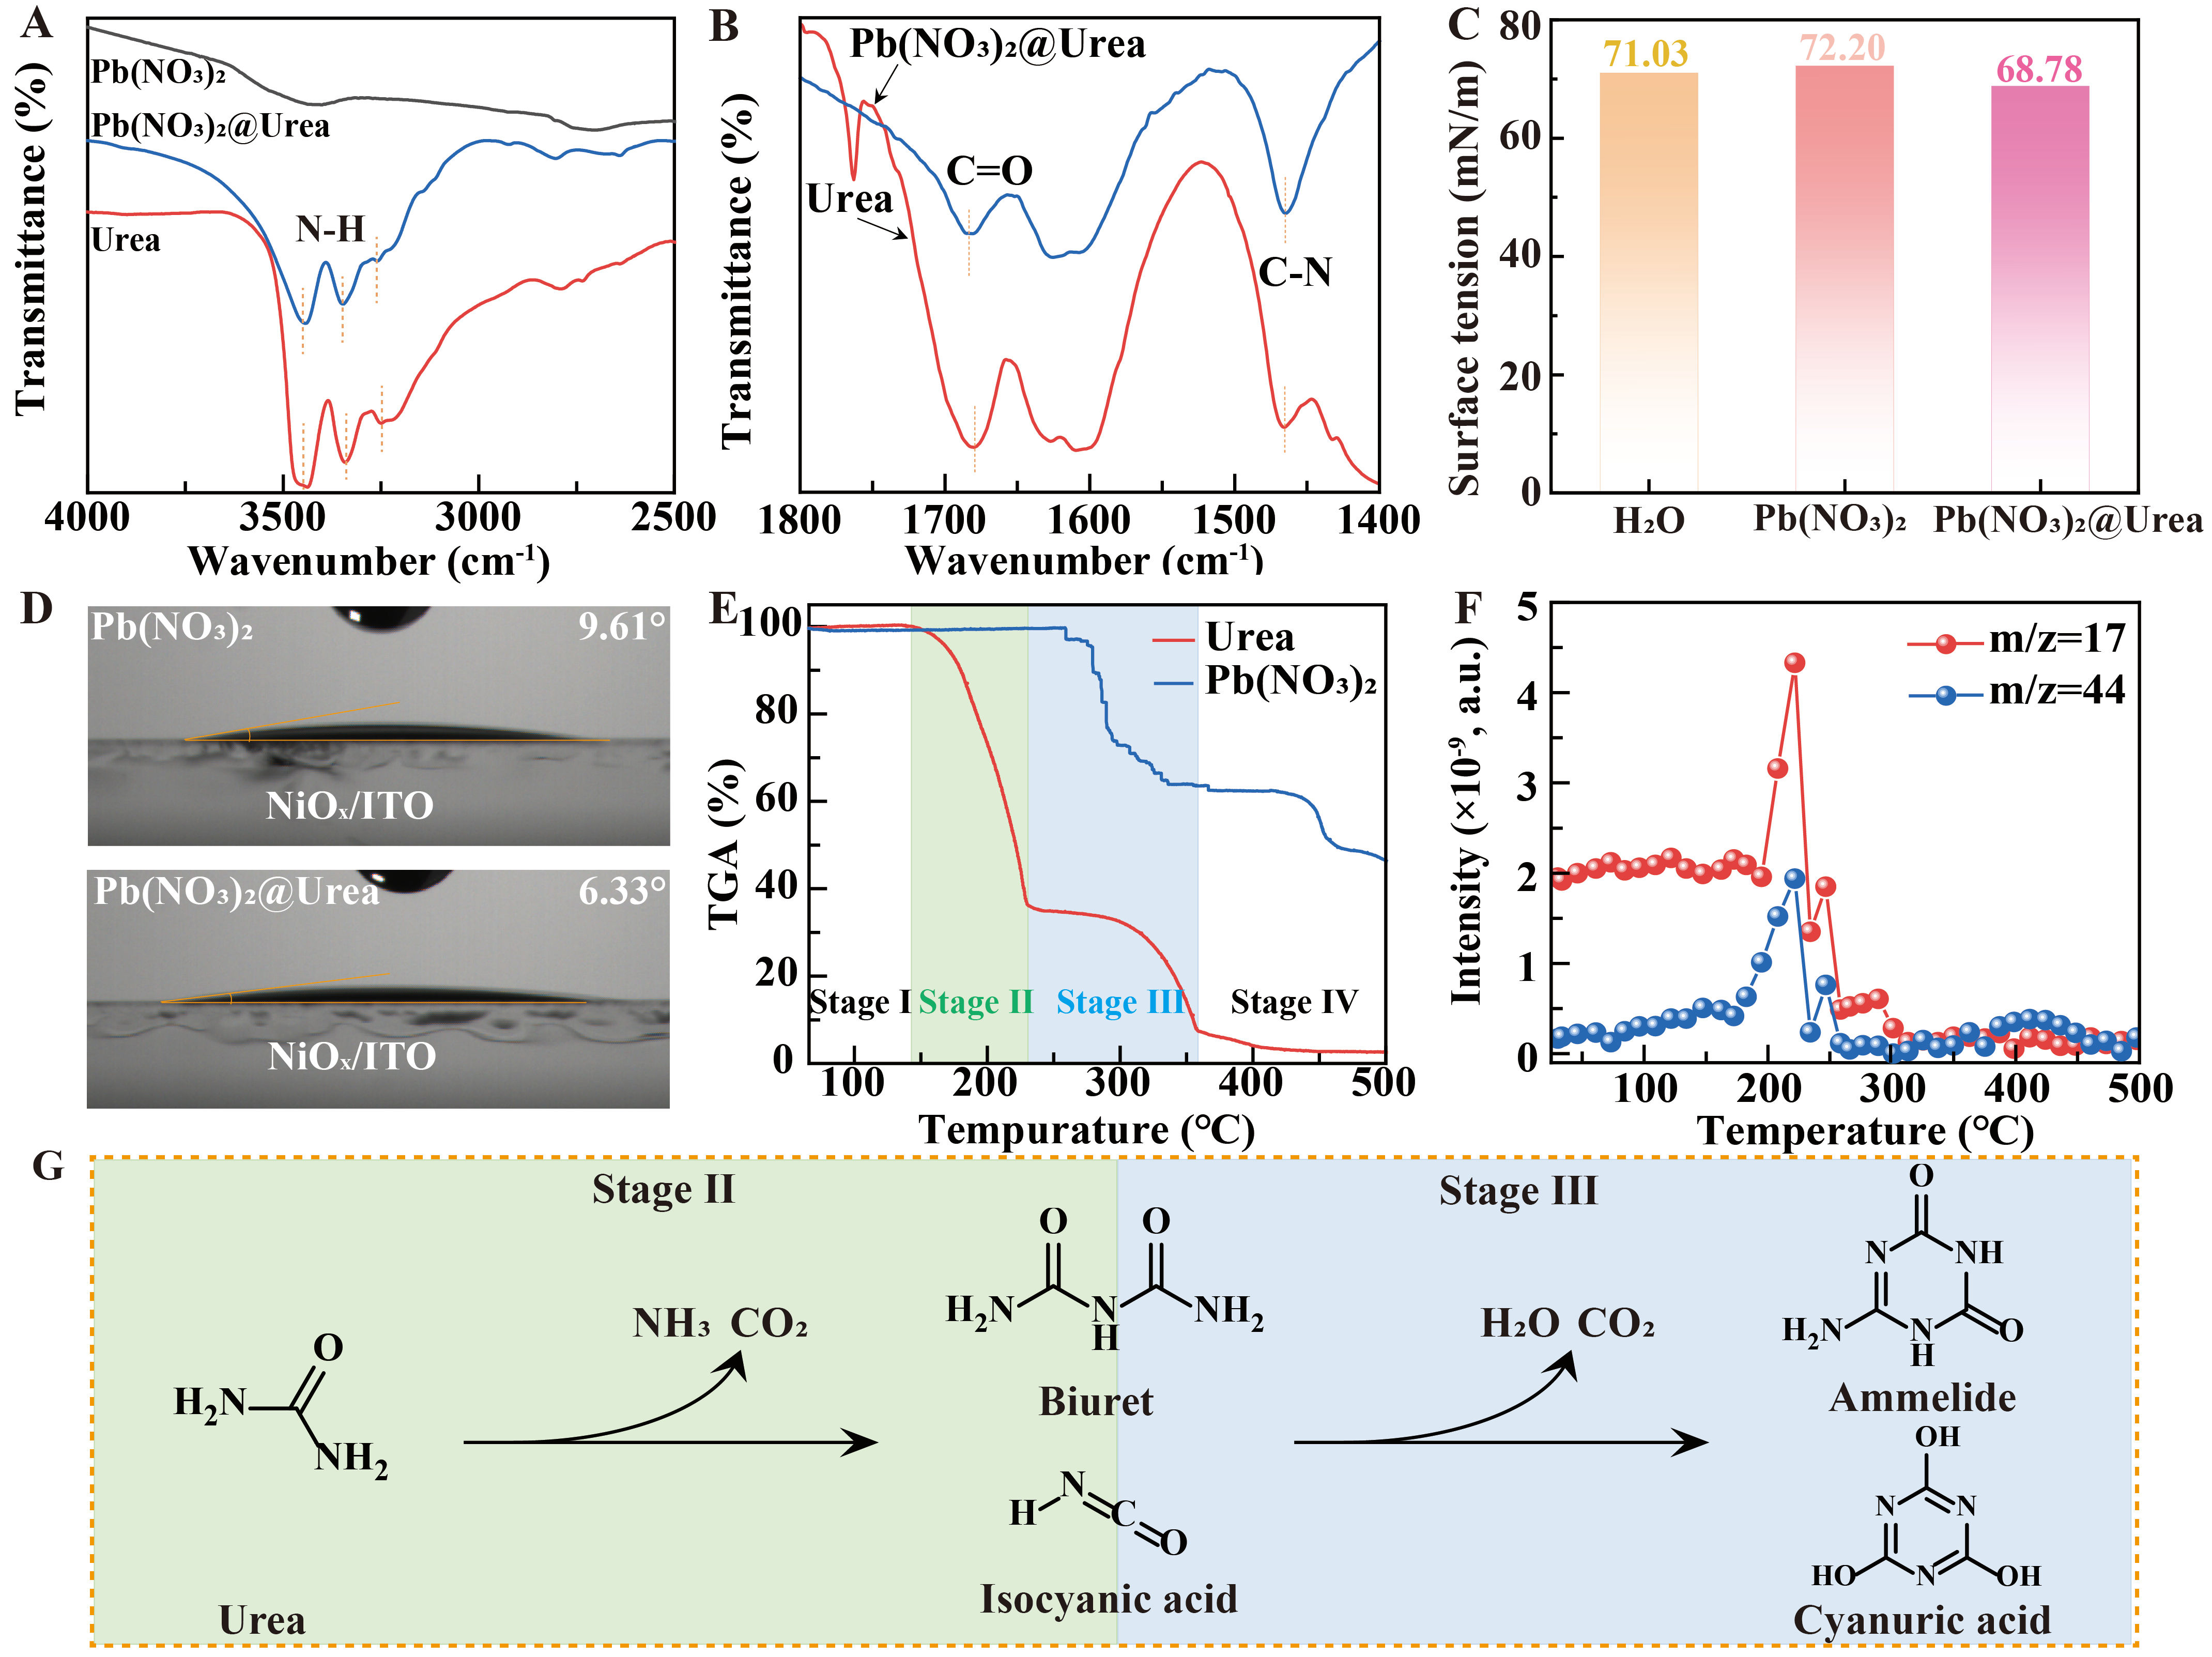
Figure 1. (A) FTIR of Pb(NO3)2, urea and Pb(NO3)2@urea in the 2,500-4,000 cm-1 range; (B) FTIR spectra of urea and Pb(NO3)2@urea in the 1,800-1,400 cm-1 range; (C) Surface tension of precursor solutions before and after the introduction of urea; (D) Contact angles of precursor solutions on NiOx substrates before and after the introduction of urea; (E) TGA curve of urea and Pb(NO3)2; (F) TG-MS profiles of the selected m/z = 17 and 44 signals during heating of urea under dry air; (G) Schematic illustration of the proposed multistep thermal transformation of urea. FTIR: Fourier transform infrared; TG-MS: thermogravimetry–mass spectrometry; TGA: thermogravimetric analysis; ITO: indium tin oxide.
To examine the effect of urea on precursor morphology, SEM measurements were performed on the Pb(NO3)2 films [Figure 2A and B, Supplementary Figure 3]. After drying at 80 °C, both the control and PU-L films already exhibited porous surface features, with average pore sizes of approximately 0.17 and 0.20 μm, respectively. Importantly, because the control film contains no urea but already exhibits porous features after drying at 80 °C, the initial porosity cannot be attributed solely to urea decomposition. The morphology of aqueous Pb(NO3)2 precursor films has also been reported to depend on film-deposition and substrate conditions[7,16]. Therefore, the pores observed at this stage are considered to arise mainly during precursor-film formation and drying, while urea induces only a modest additional morphological change. After the additional treatment at 150 °C, the average pore size of control-S remained nearly unchanged at approximately 0.16 μm [Figure 2C], whereas that of PUS-L increased from approximately 0.20 to 0.26 μm [Figure 2D]. The heat-treated urea-containing series further showed a concentration-dependent increase in pore size, reaching approximately 0.22, 0.26, and 0.46 μm for PUS-ML, PUS-L, and PUS-HL, respectively [Figure 2D and Supplementary Figure 4]. This contrast indicates that the additional pore enlargement is specifically associated with the combination of urea and the 150 °C treatment, consistent with thermally induced urea transformation contributing to pore development. Cross-sectional SEM was further employed to examine the internal morphology of the precursor films [Supplementary Figure 5]. Internal pores and voids are observed within the precursor layers, showing that the porous features are not confined to the film surface. Compared with the control, PU-L and control-S films, PUS-L exhibits more pronounced internal porosity. Together with the TG-MS results, these observations support that gas evolution associated with the thermal transformation of urea contributes to the further development of internal porosity during the 150 °C treatment. Thus, the combined urea and heat treatment regulates both the surface morphology and the internal porous structure of the Pb(NO3)2 precursor film [Figure 2E]. However, excessive pore enlargement may leave incompletely filled voids after perovskite formation and increase the risk of short-circuiting of devices. Therefore, appropriate control of the precursor pore size is important for minimizing residual voids and obtaining high-quality water-based perovskite films.
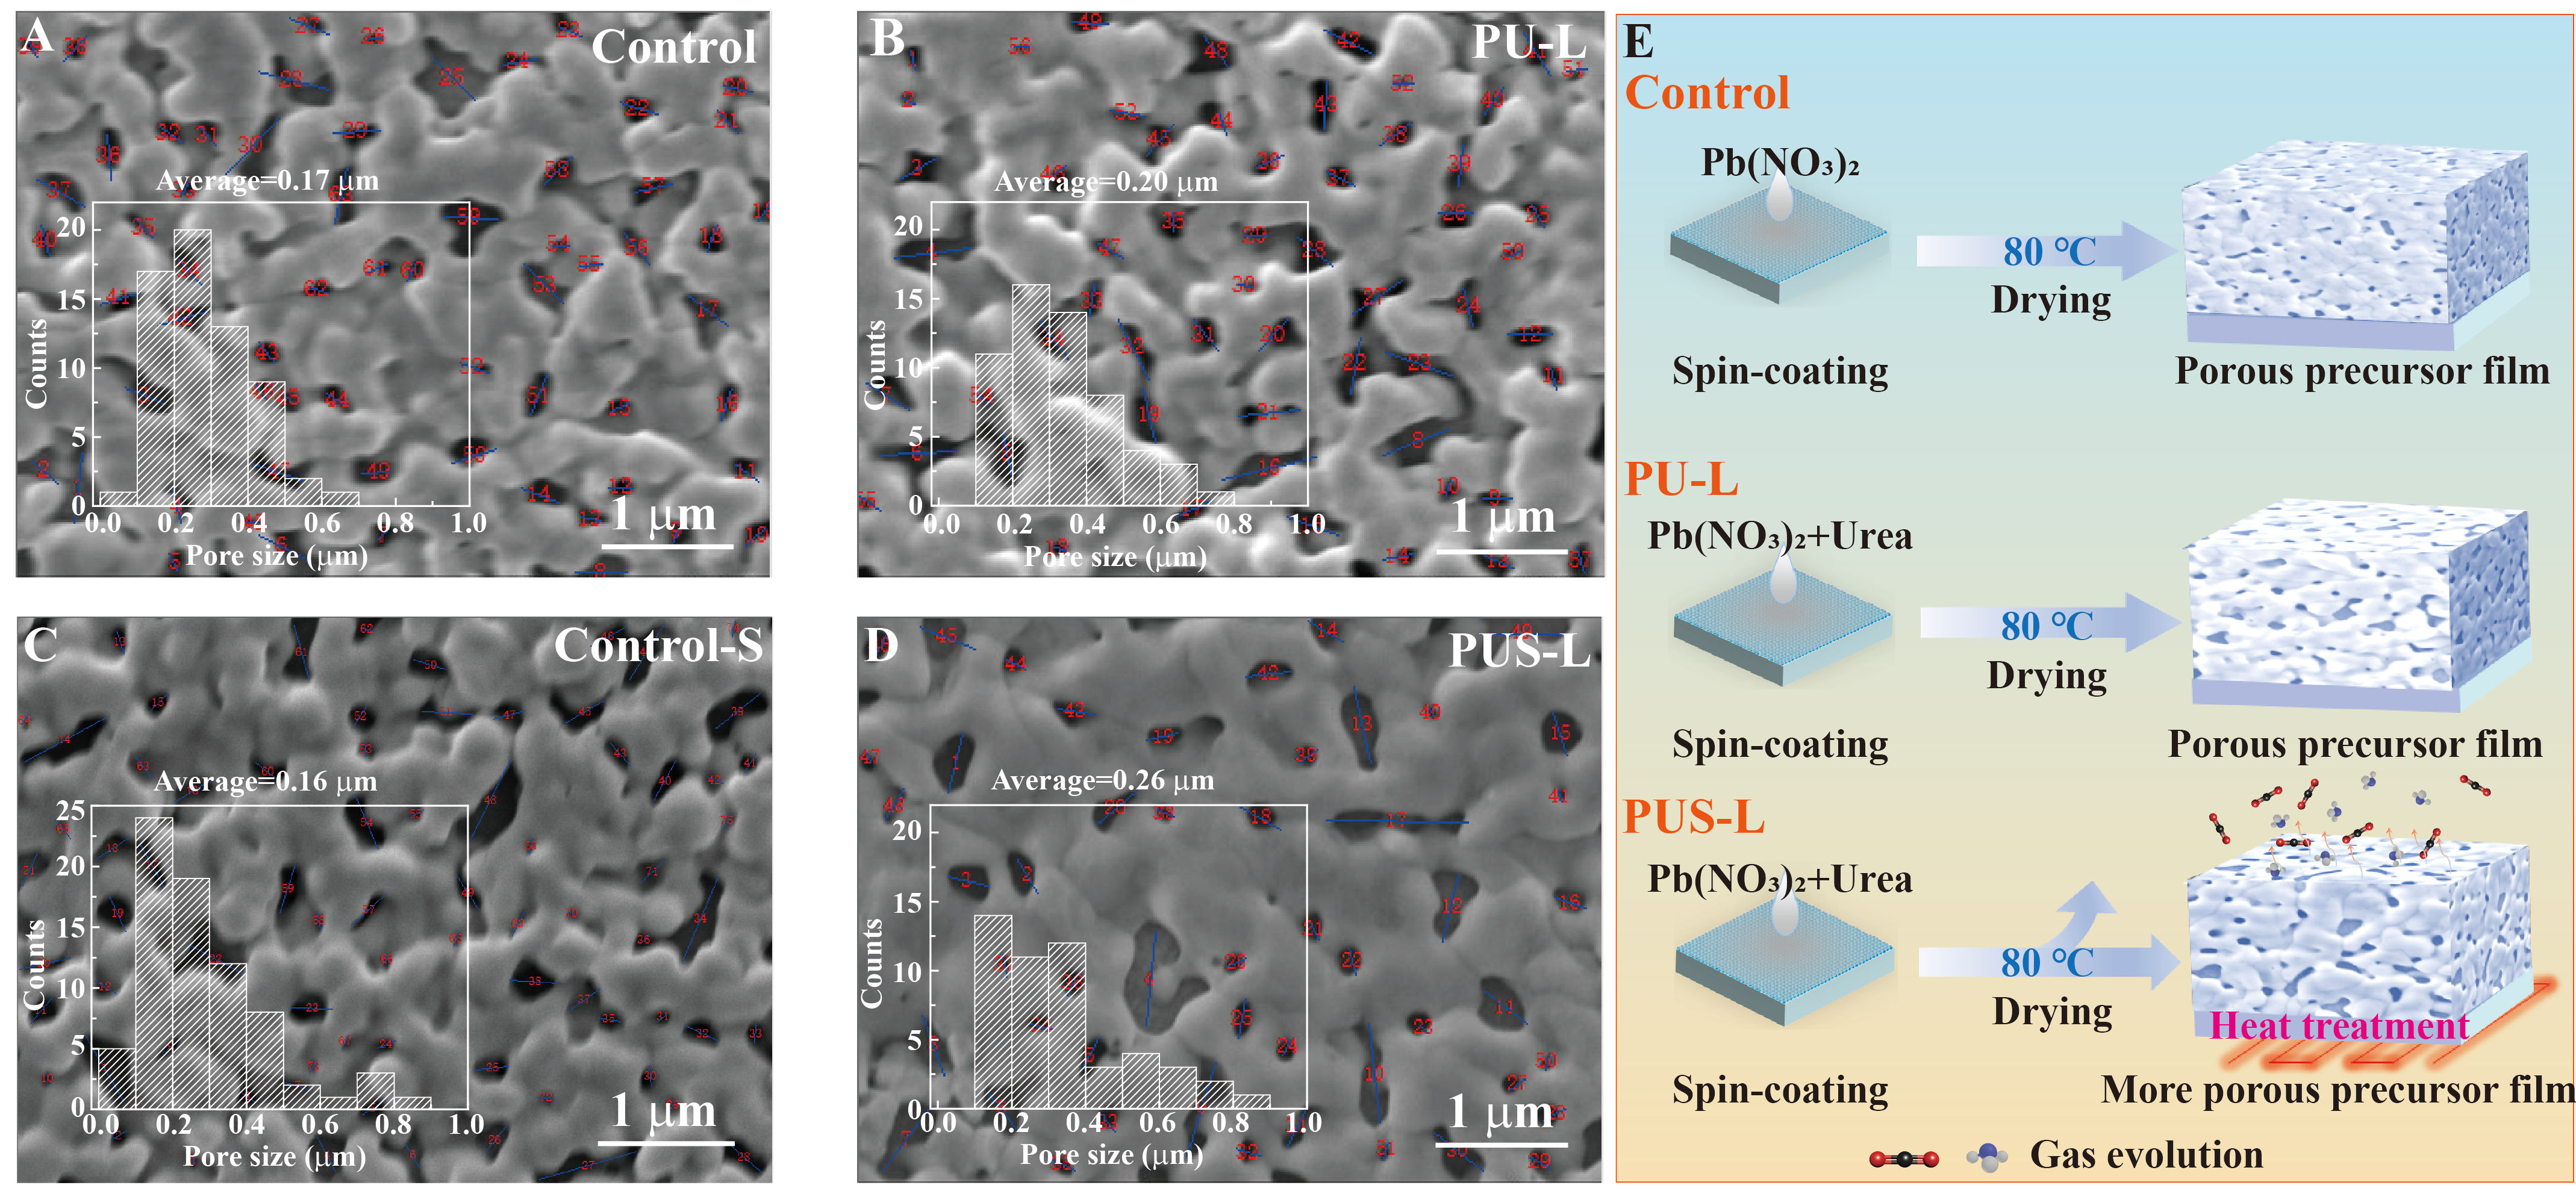
Figure 2. Surface SEM and pore-size distributions of the (A) control, (B) PU-L, (C) control-S, and (D) PUS-L precursor films; (E) Schematic illustration of the proposed pore-formation process in the precursor film. SEM: Scanning electron microscopy; PU-L: Pb(NO3)2 precursor film containing 0.3 mg/mL urea; PUS-L: the corresponding PU-L precursor film after additional heat treatment at 150 °C for 20 min.
To evaluate the effect of precursor morphology on device performance, PIW-PSCs with an ITO/NiOx/perovskite/PC61BM/BCP/Ag architecture were fabricated [Supplementary Figure 6]. Before evaluating the photovoltaic performance, the OAS incubation time was optimized using the control precursor films at 50 °C. Incubation times of 1.0, 1.5, 2.0, 2.5, and 3.0 min were examined by XRD, SEM, and device measurements. The XRD patterns show progressive development of the characteristic perovskite reflections with increasing incubation time, while extending the incubation beyond 2 min provides no clear additional improvement in phase conversion [Supplementary Figure 7]. The surface SEM also shows a clear evolution of the film morphology, with the film obtained after 2 min exhibiting a compact and relatively uniform surface [Supplementary Figure 8]. In the incubation time optimization experiment, the average PCE increased from 6.92 ± 1.80% at 1 min to 13.52 ± 0.69% at 1.5 min and reached a maximum of 15.42 ± 0.34% at 2 min. Further increasing the incubation time to 2.5 and 3 min resulted in slightly lower average PCEs of 15.20 ± 0.29% and 14.84 ± 0.27%, respectively. Therefore, an incubation time of 2 min was selected for the subsequent experiments [Supplementary Figure 9 and Supplementary Table 1]. The J-V characteristic curves of the champion devices are shown in Figure 3A and Supplementary Figure 10A. The corresponding photovoltaic parameters are summarized in Table 1 and Supplementary Table 2. In a separate experimental batch used to evaluate the effects of urea addition and additional heat treatment, the control device exhibited an average PCE of 14.27 ± 1.57% [open-circuit voltage (Voc) = 1.01 ± 0.02 V, short-circuit current density (Jsc) = 19.15 ± 0.91 mA/cm2, fill factor (FF) = 73.77 ± 6.55%]. The average PCE values for PU-ML, PU-L, and PU-HL devices were 14.72 ± 1.88% (Voc = 1.01 ± 0.03 V, Jsc = 19.61 ± 1.16 mA/cm2, FF = 73.91 ± 5.97%), 16.93 ± 0.71% (Voc = 1.02 ± 0.03 V, Jsc = 20.66 ± 0.79 mA/cm2, FF = 80.08 ± 1.24%), and 14.98 ± 1.64% (Voc = 1.02 ± 0.02 V, Jsc = 20.31 ±
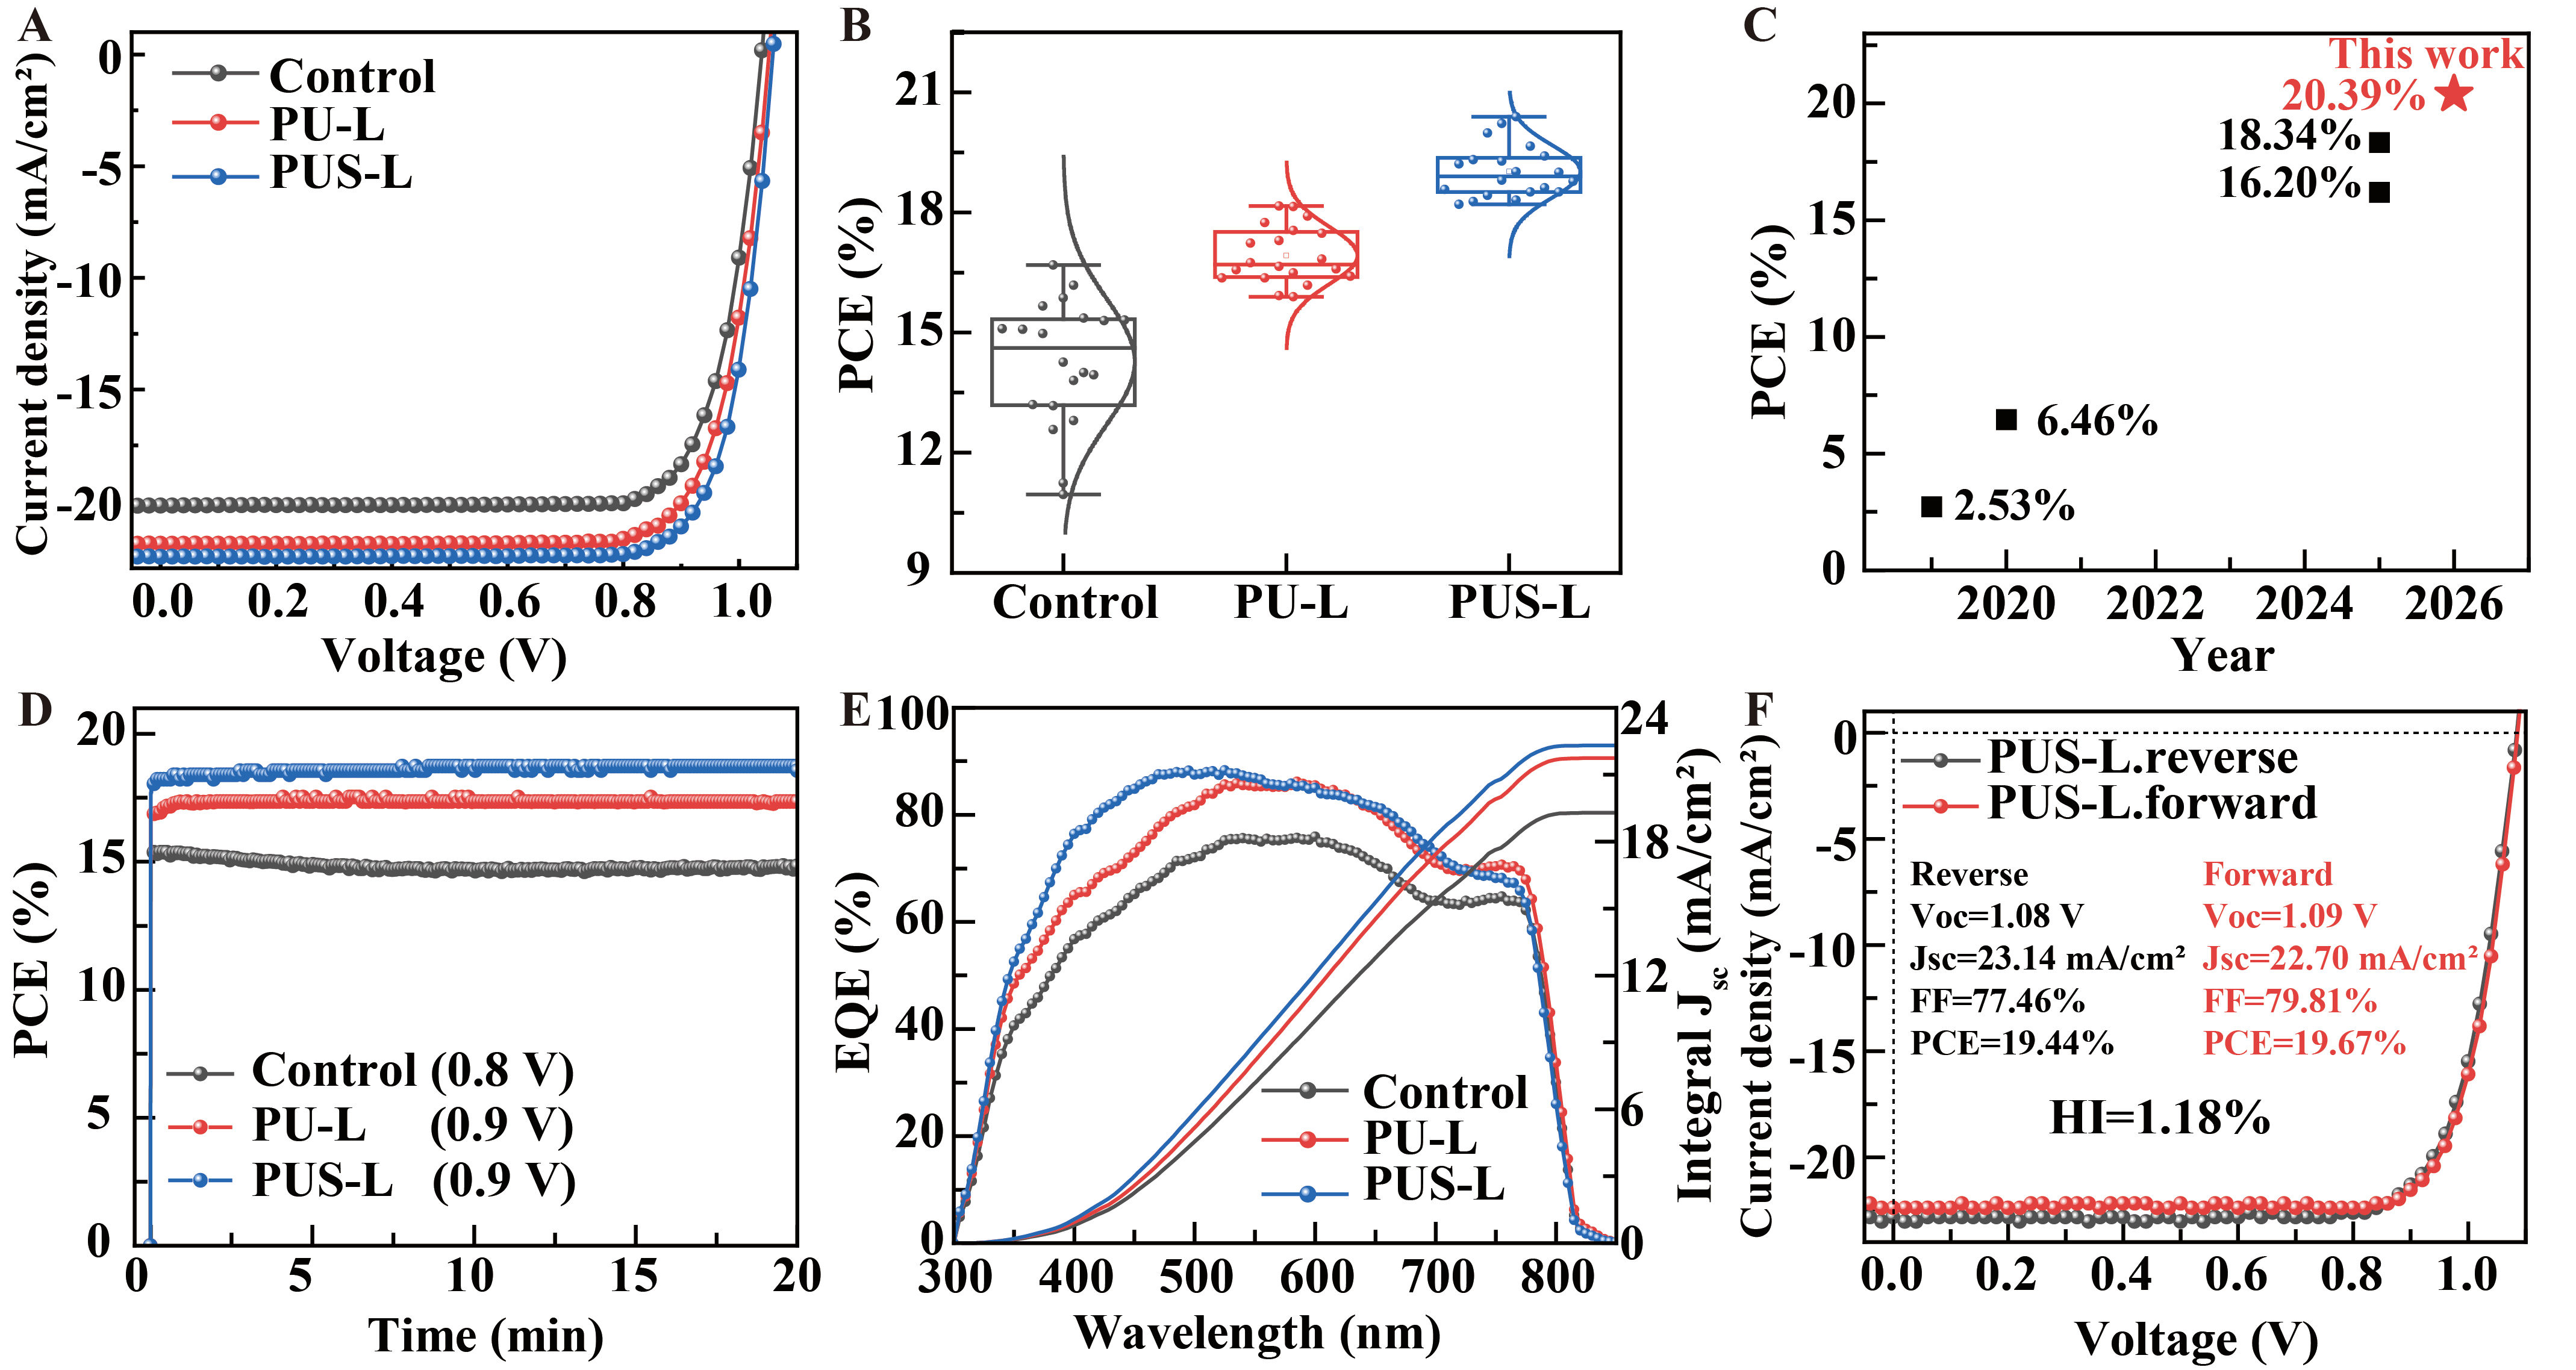
Figure 3. (A) J-V characteristic curves of devices; (B) PCE distributions of 20 sub-cells collected from independent fabrication experiments and used for the statistical analysis in Table 1; (C) Comparison of reported PCEs for PIW-PSCs[9,15,16,31]; (D) Stabilized power output of the control, PU-L, and PUS-L devices under continuous AM 1.5G illumination at fixed bias voltages corresponding to their maximum-power-point voltages determined from the J-V curves (0.8, 0.9, and 0.9 V, respectively); (E) EQE spectra and corresponding integrated current densities of representative devices; (F) J-V curves of the PUS-L device measured in the forward and reverse scan directions. PIW-PSCs: Planar inverted water-based perovskite solar cells; EQE: external quantum efficiency; HI: hysteresis index; PCE: power conversion efficiency; PU-L: sample prepared using a Pb(NO3)2 precursor containing 0.3 mg/mL urea; PUS-L: the corresponding sample after additional heat treatment at 150 °C for 20 min.
Photovoltaic performance of control, PU-L and PUS-L PIW-PSCs
| Sample | Voc (V) | Jsc (mA/cm2) | FF (%) | PCE (%) |
| Control | 1.01 ± 0.02 (1.04) | 19.15 ± 0.91 (20.19) | 73.77 ± 6.55 (79.52) | 14.27 ± 1.57 (16.69) |
| PU-L | 1.02 ± 0.03 (1.05) | 20.66 ± 0.79 (21.86) | 80.08 ± 1.24 (79.00) | 16.93 ± 0.71 (18.16) |
| PUS-L | 1.07 ± 0.02 (1.08) | 22.34 ± 0.65 (23.33) | 79.74 ± 1.46 (80.91) | 19.02 ± 0.65 (20.39) |
The EQE spectra of the devices are presented in Figure 3E and Supplementary Figure 12. The integrated current densities for control, PU-ML, PU-L, PU-HL, PUS-ML, PUS-L, and PUS-HL devices are 19.30, 19.85, 21.75, 20.29, 20.44, 22.31, and 20.73 mA/cm2, respectively. The above performance comparison indicates that among the urea-only samples, PU-L performs best; with the additional heat treatment, PUS-L yields the optimal performance. Based on these results, the control, PU-L, and PUS-L samples were selected for further mechanistic investigation. Hysteresis in perovskite optoelectronic devices mainly originates from defect state density within the film and ion migration. The hysteresis index (HI) shows values of 28.30%, 1.45%, and 1.18% for control, PU-L, and PUS-L devices, respectively [Figure 3F and Supplementary Figure 13]. The reduced HI of the PU-L device is attributed to effective defect passivation by urea; the further decrease for the PUS-L device is closely related to the reduced defect states resulting from the enlarged pore size.
To investigate the impact of urea incorporation alone and in combination with heat treatment on the perovskite conversion process, the transformation behavior was monitored by in situ UV-Vis absorption spectroscopy over 450 s [Figure 4A-C]. Both PU-L and PUS-L exhibited higher absorbance than the control at the same incubation time, with PUS-L showing the highest response. The absorbance at 700 nm extracted from the same time-dependent spectra was used to follow the conversion process. The conversion fraction α(t) (0 ≤ α(t) ≤ 1) was defined as the ratio of the absorbance measured at time t to the absorbance recorded after complete conversion. The resulting α(t) profiles show rapid initial conversion followed by progressively slower conversion at later stages [Figure 4D]. The corresponding dα/dt-α profiles are shown in Figure 4E. This behavior is consistent with increasingly limited OAS transport as the conversion proceeds into the interior of the precursor film. Similar diffusion-limited transport of OAS during sequential perovskite formation has been reported previously, particularly after the formation of an initial perovskite layer[32]. To quantitatively compare the samples under identical incubation conditions, the conversion traces measured at 50 °C were fitted by nonlinear least-squares regression using an Avrami-type expression. Time was converted from seconds to minutes for the kinetic fitting, consistent with the reported unit of k (min-1)[33]:
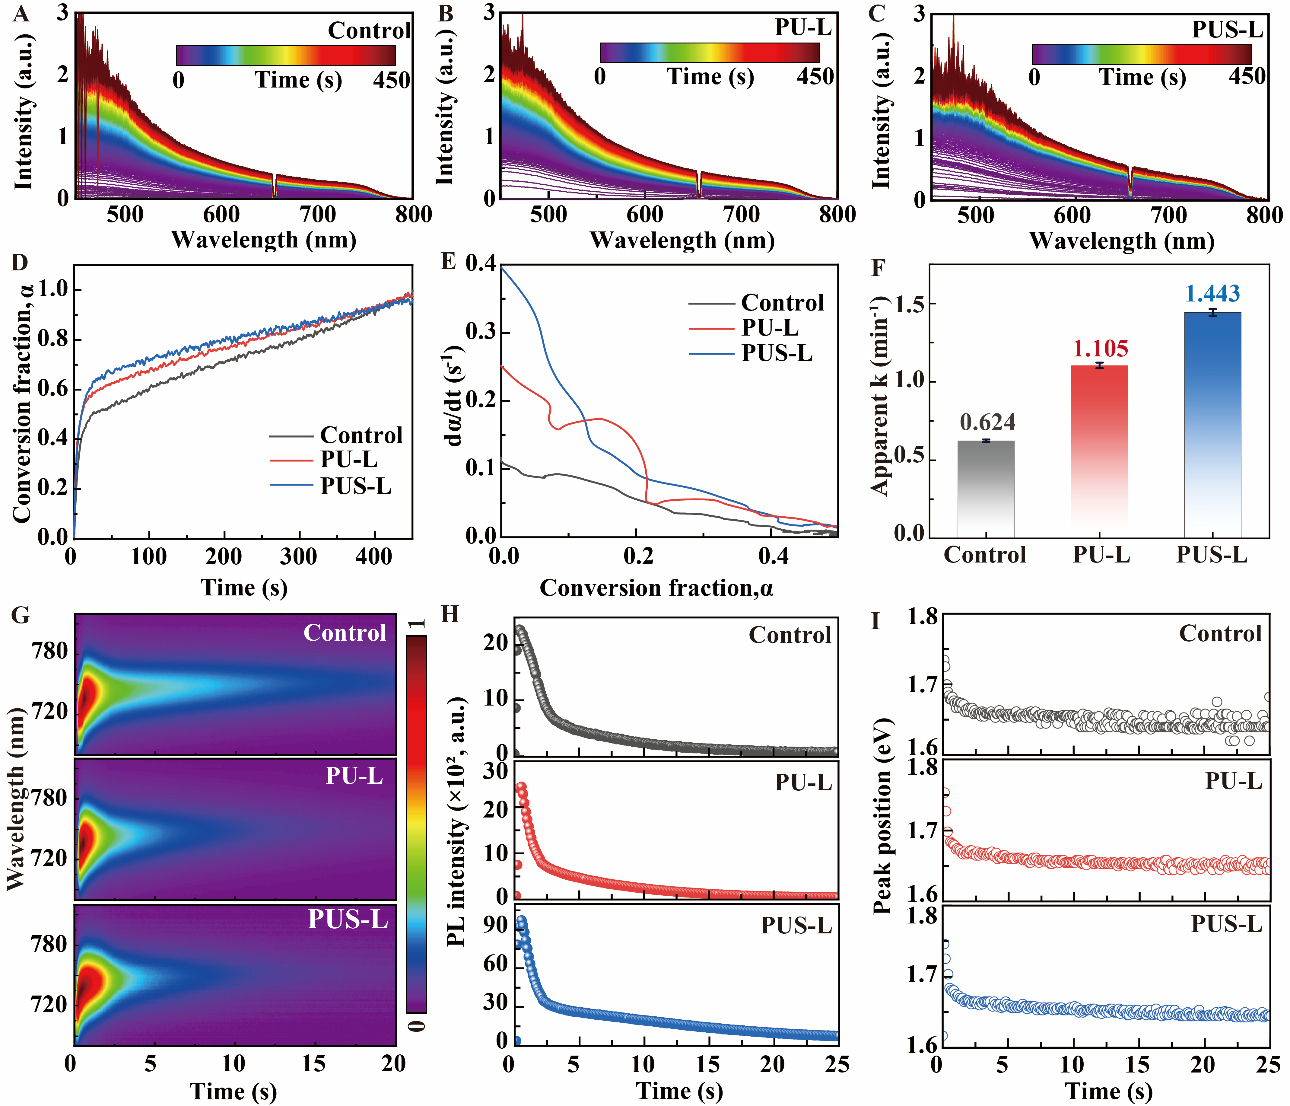
Figure 4. In situ UV-Vis spectra of (A) control, (B) PU-L, and (C) PUS-L recorded during OAS incubation from 0 to 450 s; (D) Conversion fraction α(t) derived from the absorbance at 700 nm over the same incubation period; (E) dα/dt as a function of α; (F) Apparent conversion-rate parameter k obtained by nonlinear least-squares fitting of the individual conversion traces using the Avrami-type expression. Error bars represent the standard errors obtained from nonlinear regression of the individual kinetic traces; (G) In situ PL of the incubation process of Pb(NO3)2 conversion to perovskite; (H) Peak intensity versus time curves, and (I) peak position versus time curves extracted from in situ PL during the perovskite incubation process. PL: Photoluminescence; UV-Vis: ultraviolet-visible spectroscopy; PU-L: sample prepared using a Pb(NO3)2 precursor containing 0.3 mg/mL urea; PUS-L: the corresponding sample after additional heat treatment at 150 °C for 20 min.
where k is the apparent conversion-rate parameter, and n is the Avrami exponent. The fitted k values for the control, PU-L, and PUS-L samples were 0.624 ± 0.008, 1.105 ± 0.018, and 1.443 ± 0.022 min-1, respectively [Figure 4F]. Thus, the apparent k values of PU-L and PUS-L were approximately 1.77 and 2.31 times that of the control, respectively, indicating faster conversion under the same incubation conditions. The corresponding n values were 0.456 ± 0.006, 0.368 ± 0.004, and 0.349 ± 0.003, respectively. Because the conversion involves coupled OAS transport, ion exchange, intermediate-phase evolution, and perovskite crystallization, k and n are used here for comparative fitting rather than assigned to a unique kinetic mechanism. The complete fitting parameters and regression-derived standard errors are summarized in Supplementary Table 4. To further evaluate the diffusion contribution to the slower conversion regime, the post-initial region was analyzed using a one-dimensional diffusion (D1) model[34]. The conversion was normalized as
where t0 denotes the reference time at the beginning of the sustained slower-conversion region. According to the D1 model, the normalized conversion follows
where kD is the apparent diffusion-controlled rate parameter. The corresponding linear fits are shown in Supplementary Figure 14. The fitted kD values are 0.1035 ± 0.0005, 0.1066 ± 0.0004, and 0.1101 ± 0.0002 min-1 for the control, PU-L, and PUS-L, respectively. The approximately linear D1 plots are consistent with a diffusion contribution to the slower conversion regime. The slightly higher kD values of PU-L and PUS-L are also consistent with facilitated OAS transport in the modified precursor films.
To further follow the optical evolution during the conversion process, in situ PL measurements were performed [Figure 4G]. All films exhibit a rapid increase in PL intensity at the early stage, followed by a gradual decrease [Figure 4H]. In the present sequential conversion process, OAS penetrates from the exposed surface into the Pb(NO3)2-based precursor film, and the perovskite phase progressively develops through the film. The initial PL rise is consistent with the progressive formation of emissive perovskite. Notably, PUS-L exhibits a substantially stronger PL response than the control. However, because PL intensity is also affected by defect-mediated non-radiative recombination, it is not used here as a quantitative measure of the conversion rate[35]. As the conversion proceeds toward the underlying NiOx layer, the progressively established perovskite/NiOx contact introduces additional interfacial carrier-transfer and recombination pathways that may contribute to the subsequent PL decrease[36], as shown in Supplementary Figure 15. Accordingly, the accelerated conversion of PU-L and PUS-L is primarily established by the in situ UV-Vis analysis results discussed above. The evolution of the emission peak position with incubation time is shown in Figure 4I. All investigated samples display a notable redshift: the control undergoes a shift from 1.734 to 1.639 eV, PU-L from 1.752 to 1.651 eV, and PUS-L from 1.748 to 1.645 eV, corresponding to shifts of 0.095, 0.101 and 0.103 eV, respectively. The initial high-energy emission may be associated with preferential incorporation of Cl- during the early stage of conversion, followed by progressive I- incorporation and compositional homogenization[37]. A contribution from the quantum-confinement effect of the initially formed nanocrystallites may also be involved. Specifically, smaller initial crystallites exhibit larger energy shifts[38]. Distinct conversion behaviors were observed among the control, PU-L, and PUS-L precursor films throughout the incubation process. As the reaction proceeded, the Pb(NO3)2 films underwent a gradual color transition from yellow to dark brown, a typical indicator of perovskite formation [Supplementary Figure 16]. Notably, the control film exhibited large dark areas only after 90 s of reaction, whereas both urea-modified samples (PU-L and PUS-L) displayed pronounced darkening at 45 s, indicating the earlier formation of the perovskite phase.
To examine the phase evolution during conversion, XRD measurements were performed on films incubated for different durations [Figure 5A-C]. All samples rapidly formed PbI2 during the initial incubation stage. The appearance of PbI2 as an intermediate highlights a key distinction from conventional PbI2-based sequential deposition: in the present Pb(NO3)2 route, nitrate-to-halide exchange precedes complete perovskite formation. At 30 s, residual Pb(NO3)2 remained detectable in the control film, whereas no obvious Pb(NO3)2 diffraction was observed for PU-L and PUS-L. At 60 s, the control film was dominated by the δ-FAPbI3 phase, whereas α-FAPbI3 reflections were already observed for PU-L and PUS-L, indicating earlier formation of the α phase in the modified films. Although the δ-FAPbI3 phase is present in all groups, this intermediate can be readily transformed into the photoactive α-FAPbI3 phase through post-annealing treatment[39]. To further examine the δ-to-α phase transition during annealing, time-dependent XRD measurements were performed on the same film at 150 °C [Supplementary Figure 17]. With increasing annealing time, the diffraction peak assigned to δ-FAPbI3 gradually weakened and disappeared, while the α-FAPbI3 diffraction progressively increased, confirming the transformation from the non-perovskite δ phase to the photoactive α phase during thermal annealing. This phase evolution is consistent with previous in situ XRD and grazing-incidence wide-angle X-ray scattering (GIWAXS) studies of FAPbI3[39,40]. Supplementary Figure 18 presents the XRD of the water-based perovskite films. The reflection at 12.86° originates from the (001) plane of PbI2, whereas the diffractions at 14.26°, 28.6°, and 32.08° are ascribed to the (100), (200), and (210) planes of the perovskite phase, respectively[41]. Compared with the control, the PU-L and PUS-L films exhibit weaker PbI2 diffraction and stronger perovskite reflections, consistent with more complete precursor conversion and improved crystallinity. Given that the conversion of Pb(NO3)2 into perovskite is accompanied by a volumetric expansion[15], the residual stress in the resulting perovskite films was quantitatively evaluated using the sin2ψ method. The (210) diffraction peak near 32.08° was recorded at different ψ for the control, PU-L, and PUS-L films [Figure 5D-F]. Linear fitting of 2θ as a function of sin2ψ yielded slopes of 0.52427, 0.50320, and 0.32062° for the control, PU-L, and PUS-L films, respectively [Supplementary Figure 19]. Based on these slopes, the residual stresses were calculated to be -135.9, -130.4, and -83.1 MPa, respectively, where the negative values indicate compressive stress[16]. Urea incorporation alone therefore produces only a modest decrease in the compressive stress, whereas the additional heat treatment reduces the stress magnitude of PUS-L by approximately 38.9% relative to the control. This result indicates that the porous structure developed after urea-assisted heat treatment can better accommodate the volume change associated with perovskite formation, thereby limiting the accumulation of residual compressive stress during crystallization[42]. The surface morphologies of the resulting perovskite films were further examined by SEM [Figure 5G-I]. The average grain size increased from 155.71 nm for the control film to 200.25 nm for PU-L and further to
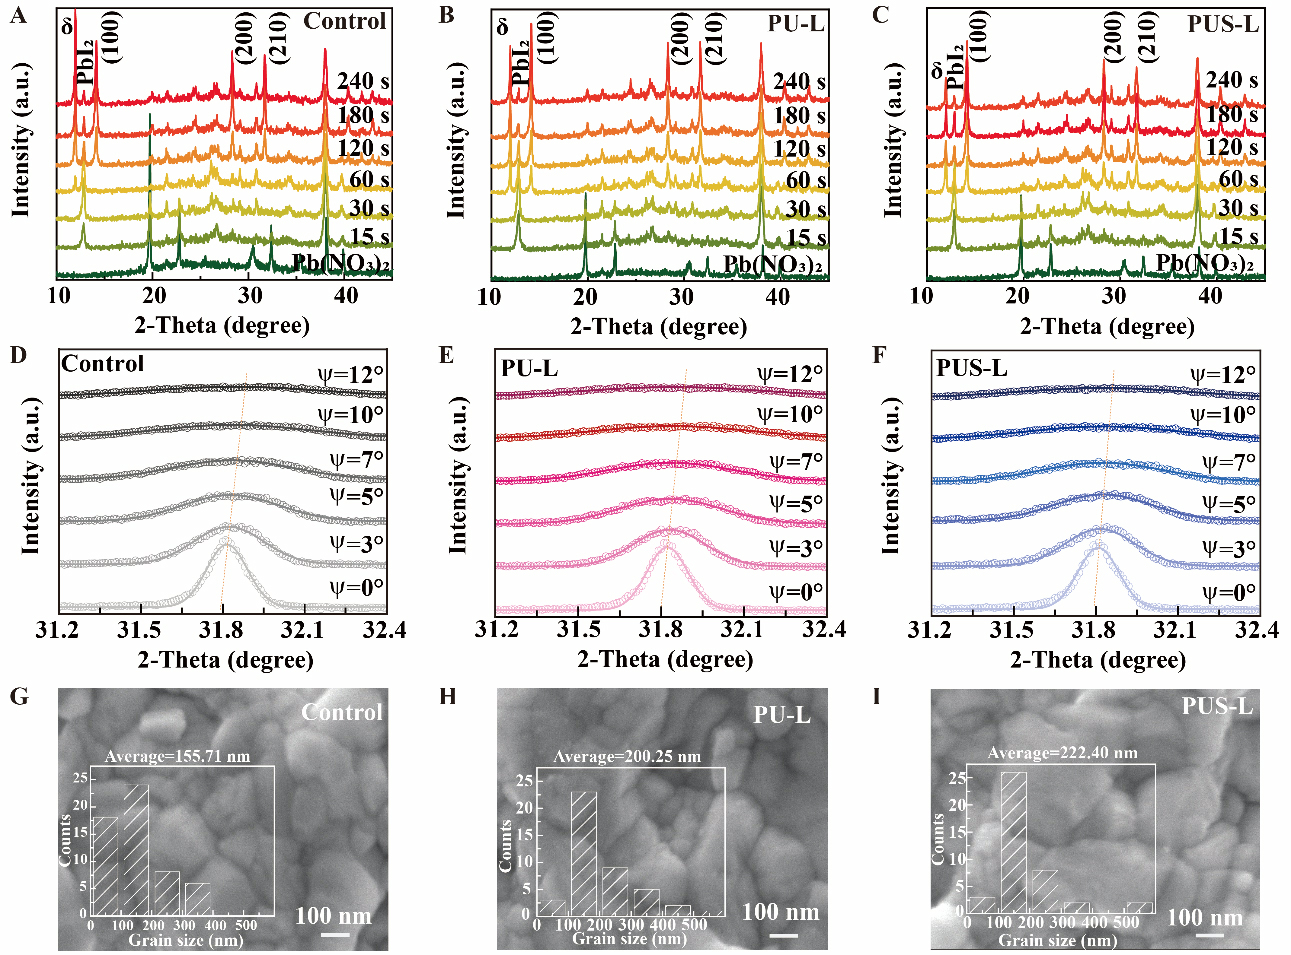
Figure 5. Time-dependent XRD patterns of (A) control, (B) PU-L, (C) PUS-L precursor films incubated in OAS solution for different durations. Tilt-angle XRD patterns of the perovskite (210) reflection for (D) control, (E) PU-L, and (F) PUS-L films at different ψ angles. Surface SEM and grain size statistics of (G) control, (H) PU-L and (I) PUS-L. XRD: X-ray diffraction; OAS: organic ammonium salts; SEM: scanning electron microscopy; PU-L: sample prepared using a Pb(NO3)2 precursor containing 0.3 mg/mL urea; PUS-L: the corresponding sample after additional heat treatment at 150 °C for 20 min.
To evaluate the effect of the treatments on trap density, hole-only devices with an ITO/NiOx/perovskite/PTAA/Au architecture were fabricated [Figure 6A], and the defect density was quantified by measuring the I-V characteristics of the devices [Figure 6B-D]. The trap-filled limit voltages (VTFL) for control, PU-L, and PUS-L were determined to be 1.082, 0.87, and 0.54 V, respectively. The defect density (Nt) of perovskite films was calculated using the space-charge limited current (SCLC) model[43]:
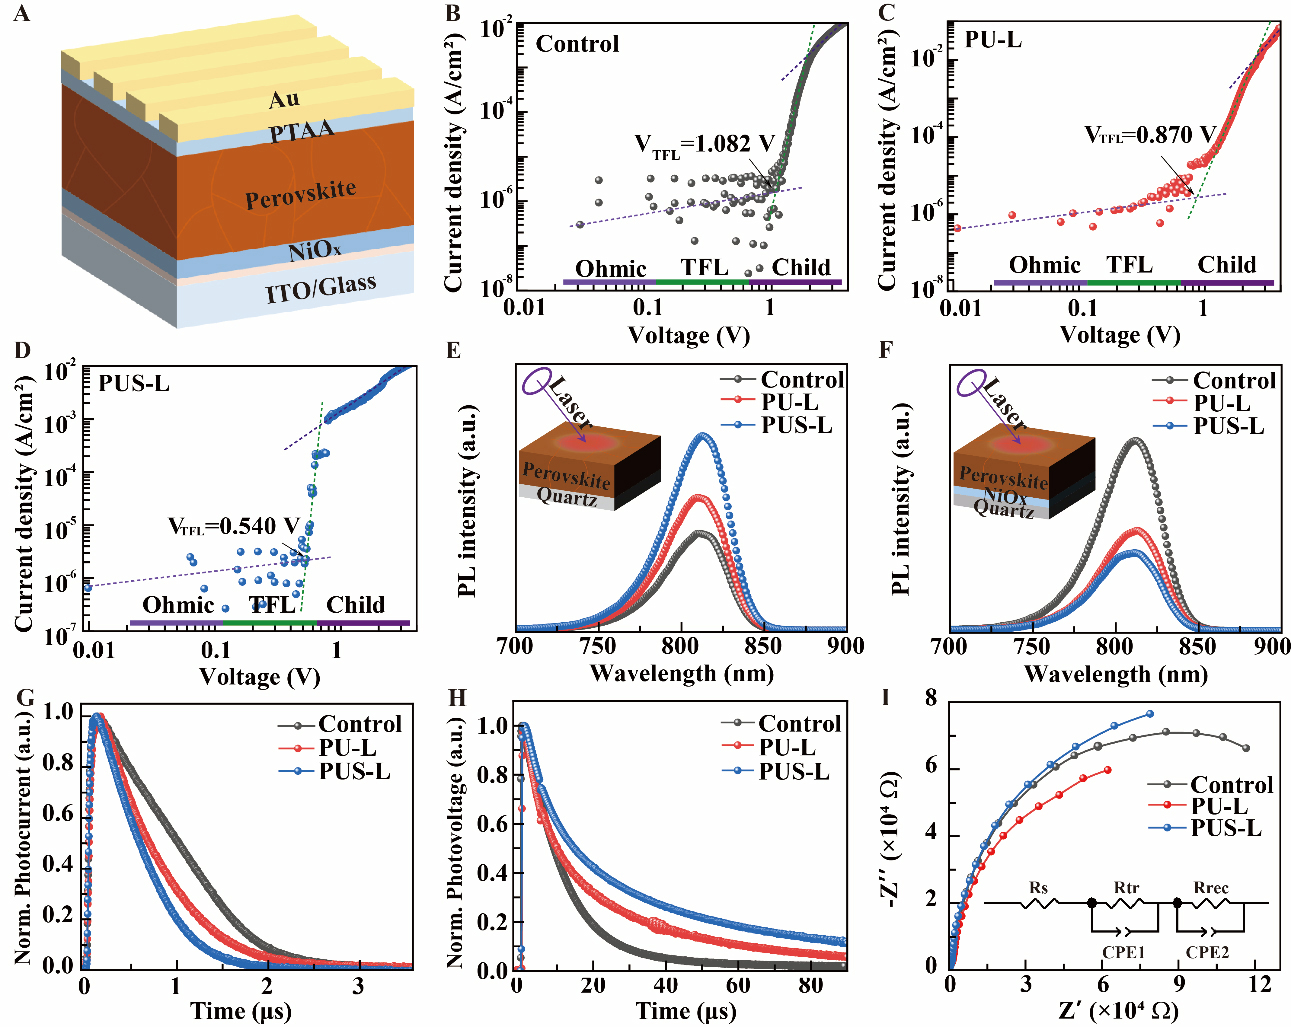
Figure 6. (A) The schematic diagram of the hole-only device. The I-V curves of (B) control, (C) PU-L, and (D) PUS-L hole-only devices. Steady-state PL spectra of the control, PU-L, and PUS-L perovskite films deposited on (E) quartz and (F) quartz/NiOx substrates; (G) TPC and (H) TPV of devices. (I) Nyquist plots of the devices, with the inset showing the equivalent circuit used for EIS fitting. TPC: Transient photocurrent; TPV: transient photovoltage; EIS: electrochemical impedance spectroscopy; PTAA: poly[bis(4-phenyl) (2,4,6-trimethylphenyl) amine]; PU-L: sample prepared using a Pb(NO3)2 precursor containing 0.3 mg/mL urea; PUS-L: the corresponding sample after additional heat treatment at 150 °C for 20 min; TFL: trap-filled limit; ITO: indium tin oxide.
where q, L, and εr were the elementary charge, film thickness, and the relative dielectric constant of FAPbI3, respectively. The defect densities of the control, PU-L, and PUS-L samples were calculated to be 5.16 × 10¹⁶, 4.15 × 10¹⁶, and 2.57 × 1016 cm-3, respectively. The progressive decrease in Nt is consistent with the improved crystallinity and morphology of the modified films. Notably, the PUS-L sample exhibits the lowest defect density, underscoring the pronounced capability of the urea-assisted thermal pore-forming approach in defect mitigation. As shown in Figure 6E, the steady-state PL intensity of the quartz/perovskite films increases from the control to PU-L and PUS-L. In the absence of a charge-extraction layer, the enhanced PL intensity is consistent with reduced defect-mediated non-radiative recombination in the PU-L and PUS-L perovskite films[44], in agreement with the progressively lower trap densities obtained from the SCLC measurements. In contrast, when the perovskite films are deposited on NiOx, PU-L and PUS-L exhibit lower PL than the control [Figure 6F]. The corresponding average TRPL lifetimes decrease from 219.67 ns for the control to 164.19 ns for PU-L and 54.70 ns for PUS-L [Supplementary Figure 20 and Supplementary Table 5]. The stronger PL quenching and faster decay indicate more rapid depletion of photoexcited carriers at the NiOx/perovskite interface[36,45]. Because both interfacial carrier transfer and non-radiative recombination can contribute to PL quenching and decay kinetics, the interfacial carrier dynamics are further examined by the transient measurements discussed below. The charge transport and recombination characteristics of the devices were probed via TPC and TPV measurements [Figure 6G-H]. The PU-L and PUS-L devices delivered shorter charge extraction times, with lifetimes of 0.68 and 0.57 μs, respectively, relative to 1.03 μs for the control, indicating faster carrier extraction. Meanwhile, the TPV decay lifetime increased from 11.2 μs for the control to 55.1 and 55.4 μs for PU-L and PUS-L, respectively, indicating suppressed carrier recombination. Together with the PL and TRPL results, these transient measurements support improved interfacial carrier extraction while suppressing recombination losses in the modified devices. To further examine the charge-transport and recombination behavior of the devices, EIS measurements were performed, and the spectra were fitted using the equivalent circuit shown in the inset of Figure 6I. The corresponding fitting parameters are summarized in Supplementary Table 6. The series resistance (Rs) increases slightly from 19.40 Ω for the control device to 26.36 Ω for PU-L and 27.77 Ω for PUS-L, indicating moderate variations in the overall ohmic and contact contributions. The transport-related resistance (Rtr) decreases from 11.49 kΩ for the control device to 6.93 kΩ for PU-L, whereas it increases to 14.36 kΩ for PUS-L after the additional heat treatment. This non-monotonic variation indicates that the improved performance of PUS-L cannot be attributed to a continuous reduction in Rtr. In contrast, the recombination resistance (Rrec) increases progressively from 122.67 kΩ for the control device to 157.10 kΩ for PU-L and 246.20 kΩ for PUS-L. The approximately twofold increase in Rrec for PUS-L relative to the control device indicates substantially suppressed carrier recombination. This interpretation is consistent with its reduced trap-state density and prolonged TPV lifetime, while the shorter TPC decay time provides independent evidence that effective charge extraction is maintained. These results suggest that the performance enhancement of PUS-L is mainly associated with reduced recombination losses while maintaining effective carrier extraction, rather than with a simple decrease in Rtr.
Thermal aging tests were performed using unencapsulated devices under N2 at 80 °C [Figure 7A]. After approximately 450 h, the PUS-L devices retained 68% of their initial PCE, compared with 57% and 62% for the control and PU-L devices, respectively. Ambient storage tests were conducted using unencapsulated devices at approximately 25 °C and 30%-35% RH [Figure 7B]. After approximately 1,000 h, the PUS-L devices retained 84% of their initial PCE, whereas the control and PU-L devices retained 43% and 54%, respectively. These results indicate improved thermal-aging and ambient-storage stability of the PUS-L devices under the tested conditions.
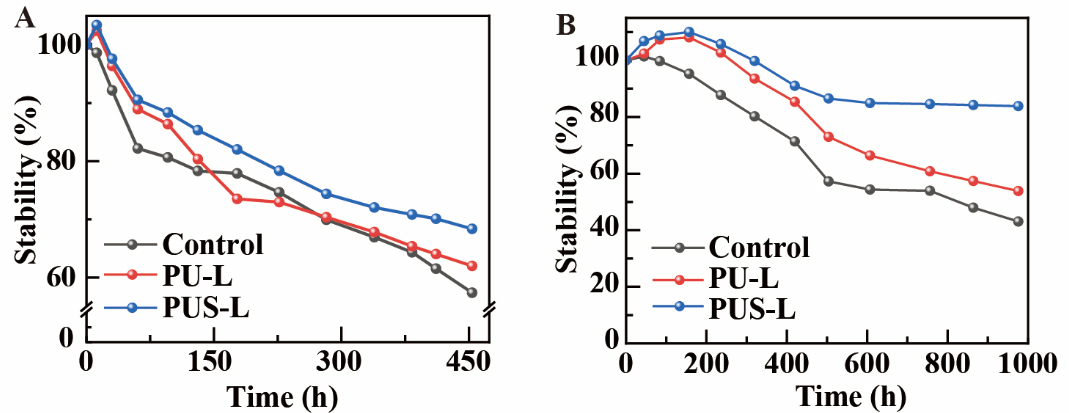
Figure 7. (A) Thermal aging of unencapsulated devices under N2 at 80 °C; (B) Ambient storage stability of unencapsulated devices at approximately
CONCLUSIONS
This work demonstrates a straightforward approach for regulating the morphology of an aqueous Pb(NO3)2 precursor through the combined use of urea and thermal treatment. Urea interacts with Pb2+ and lowers the surface tension of the precursor solution, thereby improving wetting on the substrate. Subsequent thermal treatment further promotes pore development within the precursor layer. The resulting porous structure facilitates OAS transport during nitrate-to-halide conversion, leading to more complete perovskite formation. The optimized perovskite film exhibits larger grains, a lower trap density, and reduced residual compressive stress. The corresponding inverted device achieves a champion PCE of 20.39% and maintains stable power output for 20 min at its maximum power point voltage under continuous AM 1.5G illumination. Unencapsulated PUS-L devices retain 84% of their initial PCE after approximately 1,000 h of ambient storage and 68% after 450 h of thermal aging at 80 °C under N2.
DECLARATIONS
Acknowledgments
The authors acknowledge the Analytical and Testing Center of Southwest University for technical support with SEM and FTIR characterization, Zhongke e-Test Research Service (https://www.zkec.cc/pc/school) for technical support with PL measurements and data analysis, and Wenting Liu from Scientific Compass (https://www.shiyanjia.com/) for technical assistance with the TG-MS measurements.
Authors’ contributions
Contributed equally to this work, writing - original draft, methodology, data curation and manuscript revision: Dai, Z.; Li, M.
Methodology, investigation: Zhang, Y.; Zhu, H.
Defect state measurements and a literature survey: Jiao, Y.; Tan, Y.
XRD measurement and in situ PL measurements: Chen, J.; Peng, Z.
Writing - review and editing, and supervision: Zhang, Y.; He, X.
Project administration, funding acquisition: Song, Q.
Device performance measurements and stability tests: Jiang, Z.
Availability of data and materials
The original contributions presented in this study are included in the article/Supplementary Materials. Further inquiries can be directed to the corresponding author.
AI and AI-assisted tools statement
Not applicable.
Financial support and sponsorship
The authors thank the National Natural Science Foundation of China (Grant No. 12074321), the Doctoral Scientific Research Project of Xichang University (RCZ202604), the Leshan West Silicon Materials Photovoltaic New Energy Industry Technology Research Institute (GYY202605), and the 2024 Chongqing-Sichuan Science and Technology Cooperation Project (2024cykjhz-30).
Conflicts of interest
All authors declared that there are no conflicts of interest.
Ethical approval and consent to participate
Not applicable.
Consent for publication
Not applicable.
Copyright
© The Author(s) 2026.
Supplementary Materials
REFERENCES
1. Zhou, J.; Tan, L.; Liu, Y.; et al. Highly efficient and stable perovskite solar cells via a multifunctional hole transporting material. Joule 2024, 8, 1691-706.
2. Lin, X.; Cui, D.; Luo, X.; et al. Efficiency progress of inverted perovskite solar cells. Energy. Environ. Sci. 2020, 13, 3823-47.
3. Cao, F.; Wang, M.; Li, L. Pushing the certified efficiency of inverted perovskite solar cells beyond 24%: a review. Rev. Mater. Res. 2025, 1, 100020.
4. Song, S.; Cho, H. W.; Kim, H.; Kim, M.; Kim, G. Perovskite solar cells for low earth orbit space applications. Energy. Mater. 2026, 6, 600019.
5. Galvao, J.; Davis, B.; Tilley, M.; Normando, E.; Duchen, M. R.; Cordeiro, M. F. Unexpected low-dose toxicity of the universal solvent DMSO. FASEB. J. 2014, 28, 1317-30.
6. Lee, K. P.; Chromey, N. C.; Culik, R.; Barnes, J. R.; Schneider, P. W. Toxicity of N-methyl-2-pyrrolidone (NMP): teratogenic, subchronic, and two-year inhalation studies. Fundam. Appl. Toxicol. 1987, 9, 222-35.
7. Hsieh, T. Y.; Wei, T. C.; Wu, K. L.; Ikegami, M.; Miyasaka, T. Efficient perovskite solar cells fabricated using an aqueous lead nitrate precursor. Chem. Commun. 2015, 51, 13294-7.
8. Hsieh, T.; Su, T.; Ikegami, M.; Wei, T.; Miyasaka, T. Stable and efficient perovskite solar cells fabricated using aqueous lead nitrate precursor: interpretation of the conversion mechanism and renovation of the sequential deposition. Mater. Today. Energy. 2019, 14, 100125.
9. Irshad, Z.; Adnan, M.; Lee, J. K. Efficient planar heterojunction inverted perovskite solar cells with perovskite materials deposited using an aqueous non-halide lead precursor. Bulletin. Korean. Chem. Soc. 2020, 41, 937-42.
10. Du, C.; Wang, S.; Miao, X.; et al. Polyvinylpyrrolidone as additive for perovskite solar cells with water and isopropanol as solvents. Beilstein. J. Nanotechnol. 2019, 10, 2374-82.
11. Zhai, P.; Ren, L.; Zhang, Y.; et al. Performance-limiting formation kinetics in green water-processed perovskite solar cells. Energy. Environ. Sci. 2023, 16, 3014-24.
12. Hoang, M. T.; Liu, J.; Yang, Y.; et al. Lead (II) fluoride additive modulating grains growth of water-processed metal halide perovskites for enhanced efficiency in solar cells. Mater. Futures. 2025, 4, 025103.
13. Zhai, P.; Ren, L.; Li, S.; Zhang, L.; Li, D.; Liu, S. Light modulation strategy for highest-efficiency water-processed perovskite solar cells. Matter 2022, 5, 4450-66.
14. Zhang, Y.; Ren, L.; Zhai, P.; et al. The synergistic effect of dry air and surfactants enables water to be a promising green solvent for stable and efficient perovskite solar cells. Energy. Environ. Sci. 2024, 17, 296-306.
15. Dai, Z.; He, X.; Li, M.; et al. Thermally assisted energy barrier engineering for high-performance planar inverted perovskite solar cells processed with aqueous green solvents. J. Alloys. Compd. 2025, 1035, 181462.
16. Dai, Z.; He, X.; Jiang, Z.; et al. How to construct efficient planar inverted aqueous-based perovskite solar cells using NiOx hole transport layers? ACS. Sustainable. Chem. Eng. 2025, 13, 22005-15.
17. Huang, Z.; Du, Z.; Ma, Z.; et al. Lead iodide secondary growth and π-π stack regulation for sequential perovskite solar cells with 23.62% efficiency. Che. Eng. J. 2024, 499, 156684.
18. Zhang, W.; He, L.; Zhou, Y.; et al. Multiple roles of negative thermal expansion material for high-performance fully-air processed perovskite solar cells. Chem. Eng. J. 2023, 457, 141216.
19. Bu, T.; Li, J.; Li, H.; et al. Lead halide-templated crystallization of methylamine-free perovskite for efficient photovoltaic modules. Science 2021, 372, 1327-32.
20. Vijayan, S.; Narasimman, R.; Prabhakaran, K. A urea crystal templating method for the preparation of porous alumina ceramics with the aligned pores. J. Eur. Ceram. Soc. 2013, 33, 1929-34.
21. Xiao, W.; Miao, C.; Yin, X.; et al. Effect of urea as pore-forming agent on properties of poly(vinylidene fluoride-co-hexafluoropropylene)-based gel polymer electrolyte. J. Power. Sources. 2014, 252, 14-20.
22. Li, Y.; Chen, Y.; Ding, K.; et al. Localized lead-chelating insulator bottom contact for efficient and stable p-i-n perovskite solar cells. Adv. Sci. 2025, 12, e09816.
23. Porwal, S.; Bansal, N. K.; Ghosh, S.; Singh, T. Stress-induced stabilization of the photoactive FAPbI3 phase under ambient conditions without using an additive approach. Energy. Adv. 2024, 3, 894-903.
24. Feng, Z.; Wang, Y.; Si, J.; et al. Multi-site lead passivation via spatial configuration modulation of additives for efficient perovskite solar cells. Adv. Energy. Mater. 2025, 15, 2502409.
25. Guo, F.; Li, M.; Wang, X.; et al. Carbonyl-amine synergistic dual-site passivation for efficient and stable wide-bandgap perovskite solar cells. Adv. Funct. Mater. 2026, 36, e00017.
26. Mukherjee, C.; Singh, M.; Bhanumati, S. Comparative study of ionic interactions of 1:1 and 1:2 electrolytes of nitrates salts solutions with water analysed with physicochemical data. Phys. Chem. Liq. 2012, 50, 617-29.
27. Frank, H. S.; Franks, F. Structural approach to the solvent power of water for hydrocarbons; urea as a structure breaker. J. Chem. Phys. 1968, 48, 4746-57.
28. Zuo, C.; Hao, F.; Dong, H.; et al. Regulating solution spreading and intermediate phase evolution for large-area perovskite films and solar modules. Energy. Environ. Sci. 2025, 18, 10125-34.
29. Mo, C.; Mo, Y.; Chen, J.; Long, H.; Qiu, C.; Jiang, M. Thermal decomposition process of urea in SCR system for diesel engine. J. Combust. Sci. Technol. 2021, 27, 16-22. https://jglobal.jst.go.jp/en/detail?JGLOBAL_ID=202102245927979018 (accessed 2026-09-09).
30. Krum, K.; Patil, R.; Christensen, H.; et al. Kinetic modeling of urea decomposition and byproduct formation. Chem. Eng. Sci. 2021, 230, 116138.
31. Pothiklang, C.; Hongsith, K.; Ruankham, P.; Choopun, S. Synthesis of perovskite film by using lead nitrate as precursor for perovskite solar cell applications. Mater. Today. Proc. 2019, 17, 1224-30.
32. Ko, H.; Sin, D. H.; Kim, M.; Cho, K. Predicting the morphology of perovskite thin films produced by sequential deposition method: a crystal growth dynamics study. Chem. Mater. 2017, 29, 1165-74.
33. Ummadisingu, A.; Grätzel, M. Revealing the detailed path of sequential deposition for metal halide perovskite formation. Sci. Adv. 2018, 4, e1701402.
34. Khawam, A.; Flanagan, D. R. Solid-state kinetic models: basics and mathematical fundamentals. J. Phys. Chem. B. 2006, 110, 17315-28.
35. Mrkyvkova, N.; Held, V.; Nádaždy, P.; et al. Combined in situ photoluminescence and X-ray scattering reveals defect formation in lead-halide perovskite films. J. Phys. Chem. Lett. 2021, 12, 10156-62.
36. Khan, J. I.; Isikgor, F. H.; Ugur, E.; et al. Charge carrier recombination at perovskite/hole transport layer interfaces monitored by time-resolved spectroscopy. ACS. Energy. Lett. 2021, 6, 4155-64.
37. Yoon, S. J.; Stamplecoskie, K. G.; Kamat, P. V. How lead halide complex chemistry dictates the composition of mixed halide perovskites. J. Phys. Chem. Lett. 2016, 7, 1368-73.
38. Huang, T.; Tan, S.; Nuryyeva, S.; et al. Performance-limiting formation dynamics in mixed-halide perovskites. Sci. Adv. 2021, 7, eabj1799.
39. Pool, V. L.; Dou, B.; Van Campen, D. G.; et al. Thermal engineering of FAPbI3 perovskite material via radiative thermal annealing and in situ XRD. Nat. Commun. 2017, 8, 14075.
40. Wang, X.; Zheng, G.; Gao, F.; et al. In situ study of purified phase transition path for α-FAPbI3 crystallization. Adv. Energy. Mater. 2024, 14, 2303949.
41. Shi, B.; Liu, P.; Sunli, Z.; et al. Halogen anion pre-homogenization of sequentially deposited wide bandgap perovskites for commercial textured perovskite/silicon tandem solar cells. Energy. Environ. Sci. 2025, 18, 6297-306.
42. He, Z.; Zhou, Y.; Kou, T.; et al. Decoupling photoinduced lattice evolution via grain spatial isolation for perovskite solar cells. Adv. Mater. 2026, 38, e11062.
43. Duan, H.; Jin, J.; Liu, X.; et al. Electron-donor/-acceptor ratio-guided molecular engineering for buried interface optimization in n-i-p perovskite solar cells. Energy. Mater. 2026, 6.
44. Zhang, Z.; Yang, J.; Wu, Z.; et al. Revealing bifunctional molecules induced adequate DMSO extraction in sequential crystallization toward efficient and robust flexible perovskite solar cells. Adv. Funct. Materials. 2026, 36, e22596.
Cite This Article
 Open Access
How to Cite
Download Citation
Export Citation File:
Type of Import
Tips on Downloading Citation
Citation Manager File Format
Type of Import
Direct Import: When the Direct Import option is selected (the default state), a dialogue box will give you the option to Save or Open the downloaded citation data. Choosing Open will either launch your citation manager or give you a choice of applications with which to use the metadata. The Save option saves the file locally for later use.
Indirect Import: When the Indirect Import option is selected, the metadata is displayed and may be copied and pasted as needed.
About This Article
Copyright

Data & Comments
Data
0








Comments
Comments must be written in English. Spam, offensive content, impersonation, and private information will not be permitted. If any comment is reported and identified as inappropriate content by OAE staff, the comment will be removed without notice. If you have any queries or need any help, please contact us at support@oaepublish.com.