



fig2
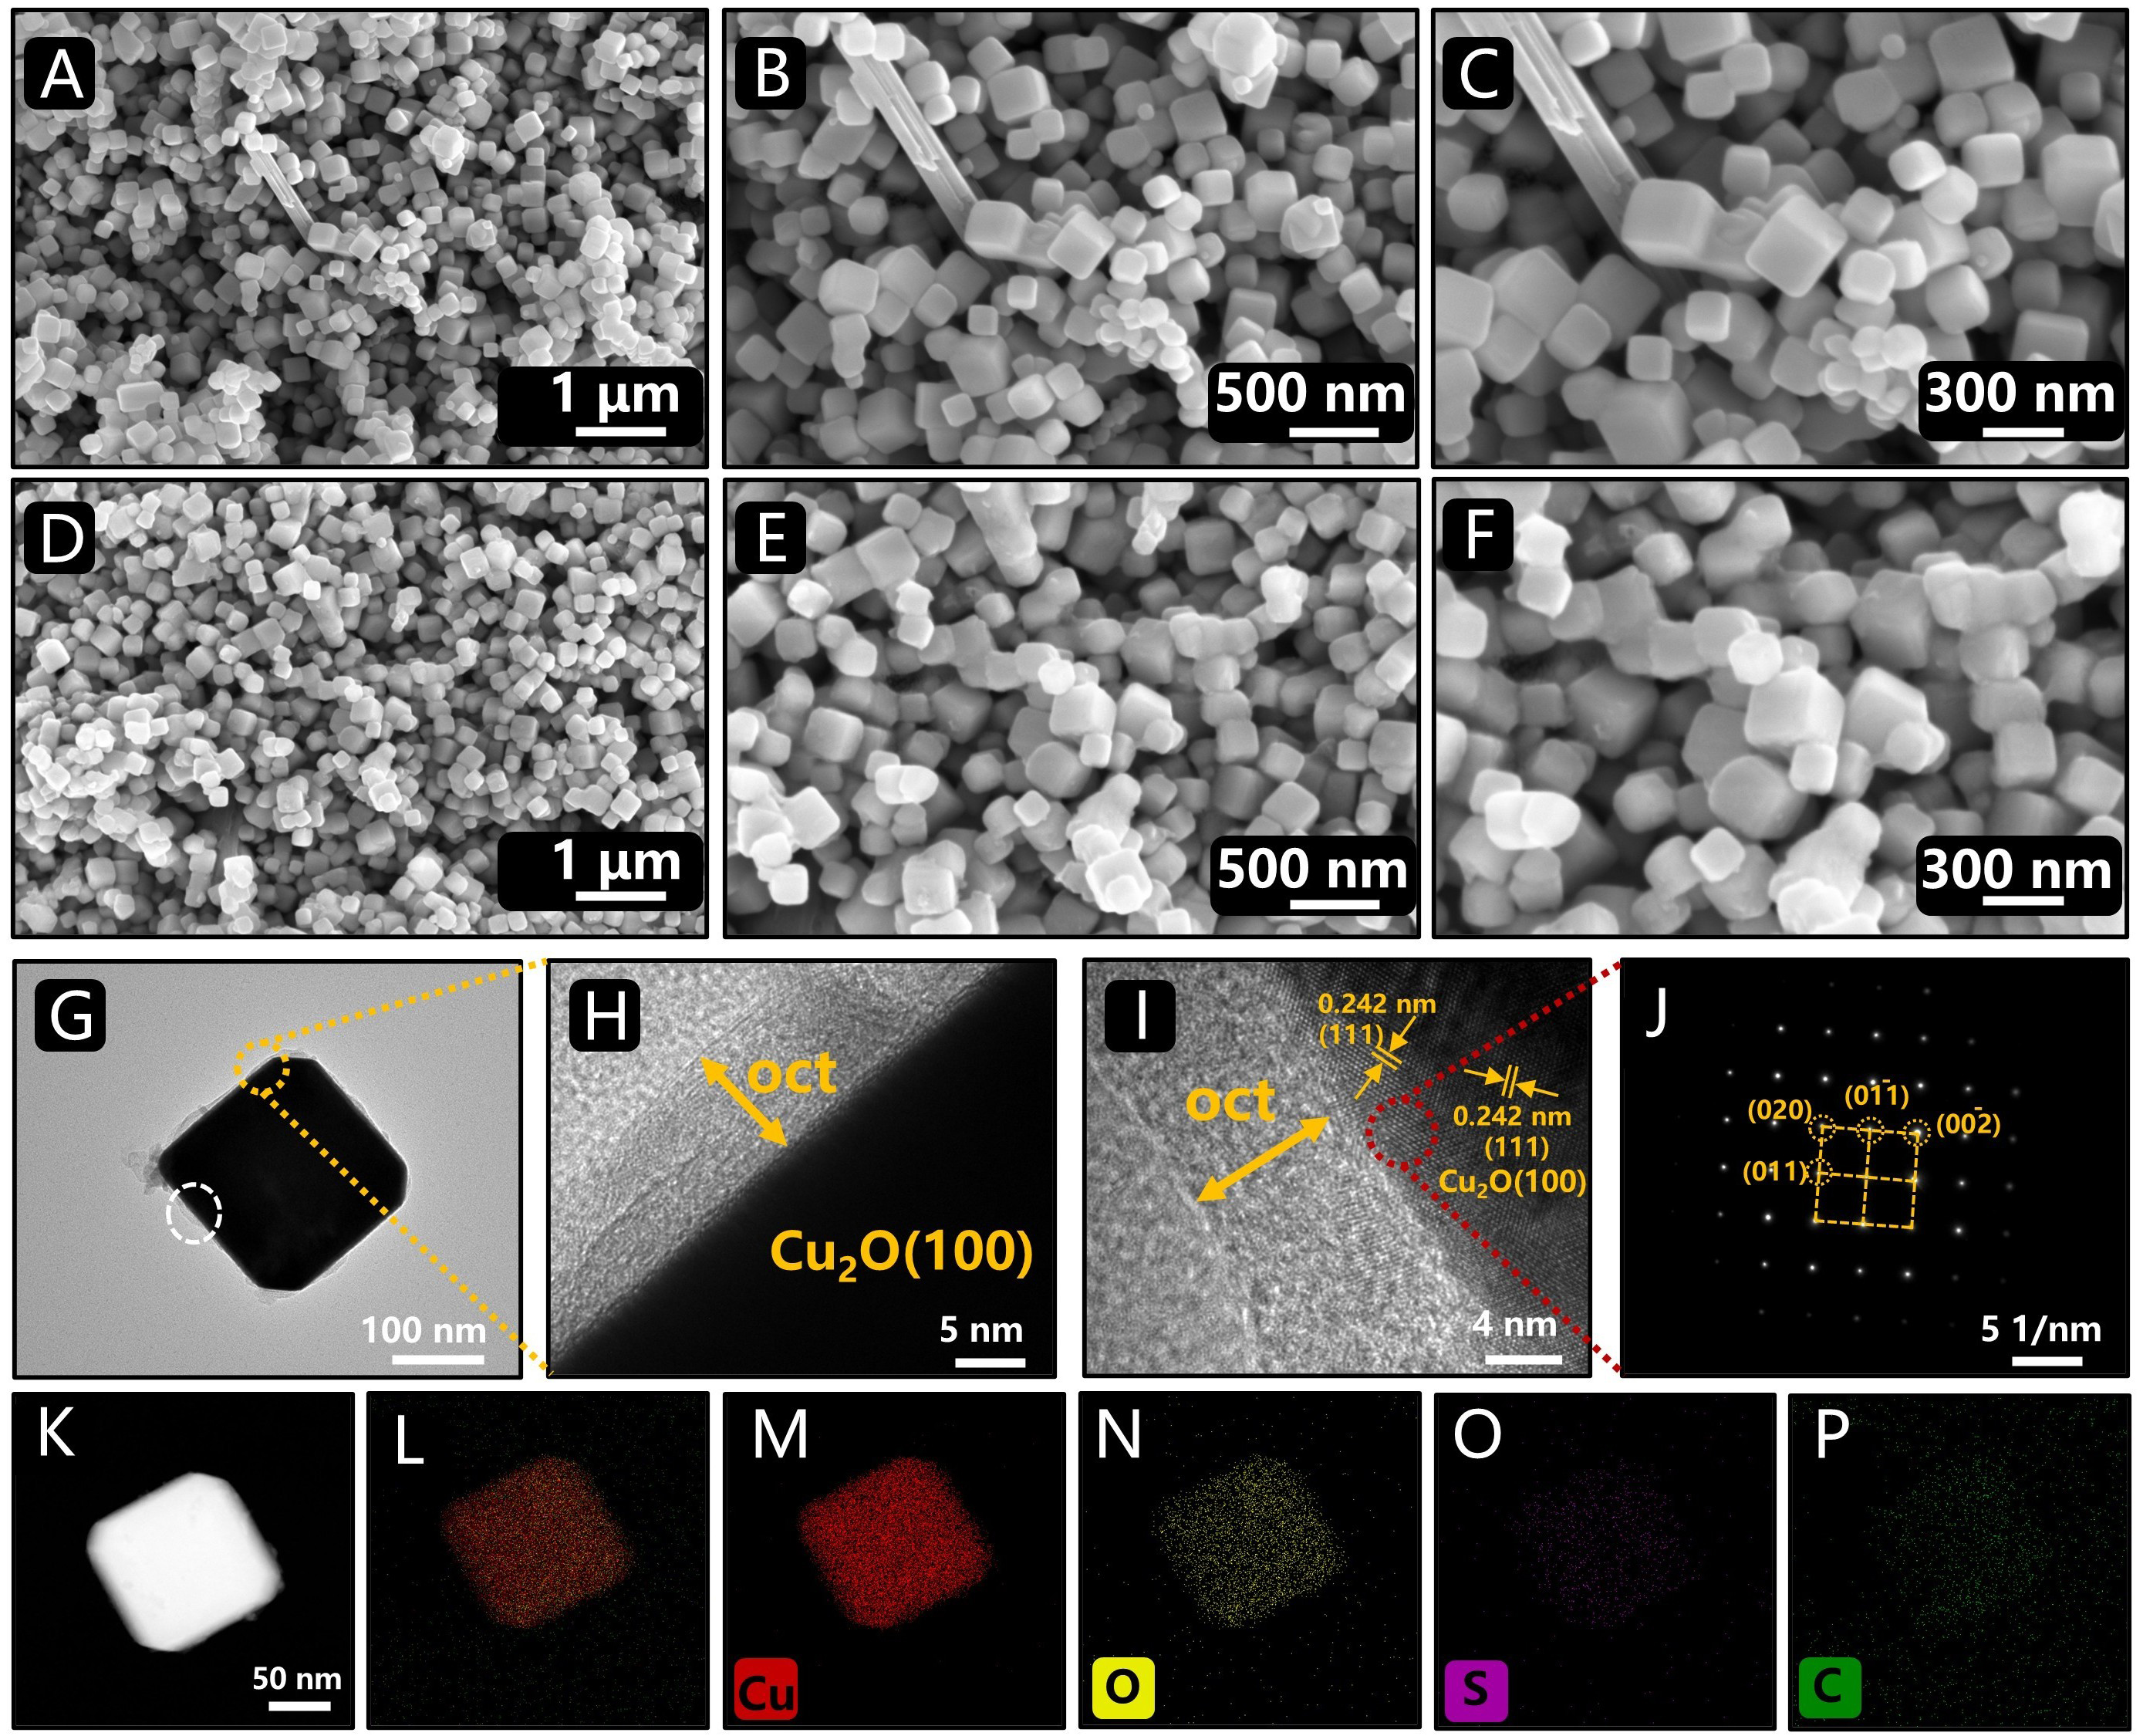
Figure 2. Morphological characterization of the samples. SEM images of Cu2O (100) at different magnifications (A-C): scale bars are 1 μm (A), 500 nm (B), and 300 nm (C); SEM images of HY-Cu2O (100) at different magnifications (D-F): scale bars are 1 μm (D), 500 nm (E), and 300 nm (F); TEM image of HY-Cu2O (100) (G); HRTEM images (H and I) show enlarged views of the yellow and white boxed regions in (G), respectively; SAED pattern of HY-Cu2O (100) (J); HAADF-STEM image (K); EDS spectrum map (L); elemental EDS maps for Cu, O, S, and C (M-P), all with a 50 nm scale bar. TEM: Transmission electron microscopy; EDS: energy-dispersive X-ray spectroscopy; HAADF: high-angle annular dark-field; SEM: scanning electron microscopy; HRTEM: high-resolution transmission electron microscopy; SAED: selected-area electron diffraction; STEM: scanning transmission electron microscopy.