



fig3
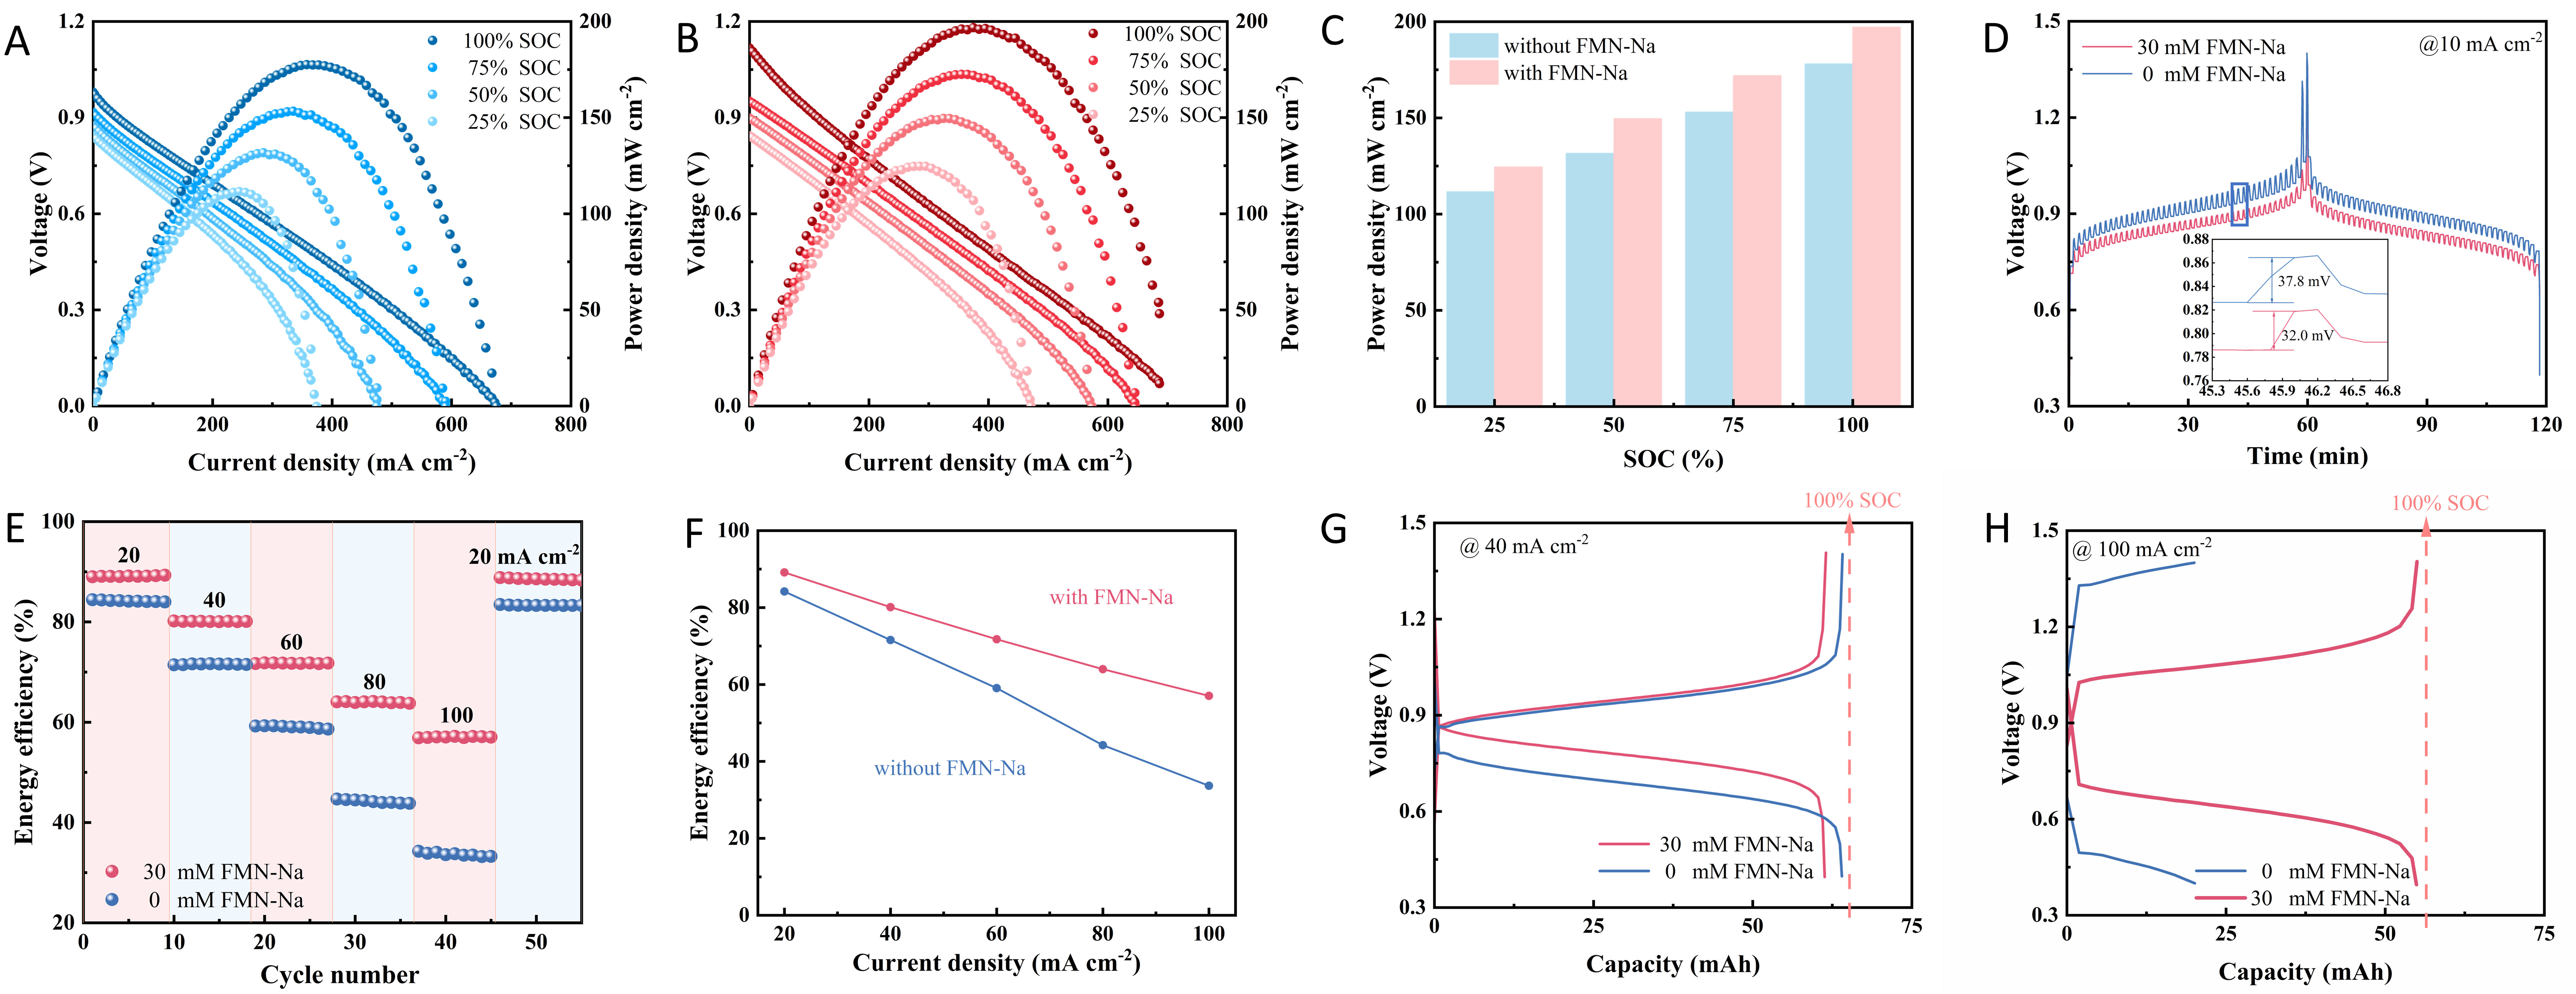
Figure 3. (A and B) Polarization curves of Fe-S RFB cells (A) without and (B) with 30.0 mM FMN-Na catalyst at various SOCs; (C) Comparison of peak power density at different SOCs; (D) GITT curves; (E) Rate performance of Fe-S RFB cells with and without 30.0 mM FMN-Na. The cell composition was 20.0 mL 2.0 M K2S + 1.0 M KCl, with or without FMN-Na | PFSA | 25.0 mL 0.1 M K4[Fe(CN)6] + 2.0 M KCl; (F) Comparison of average EE of Fe-S RFB cells with and without FMN-Na at different current densities; (G and H) Selected voltage-capacity profiles at current densities of (G) 40 mA cm-2 and (H) 100 mA cm-2. FMN-Na: Flavin mononucleotide sodium salt; SOC: state of charge; Fe-S RFB: ferrocyanide-polysulfide redox flow battery; GITT: galvanostatic intermittent titration technique; PFSA: perfluorosulfonic acid membrane; EE: energy efficiency.





