


fig4
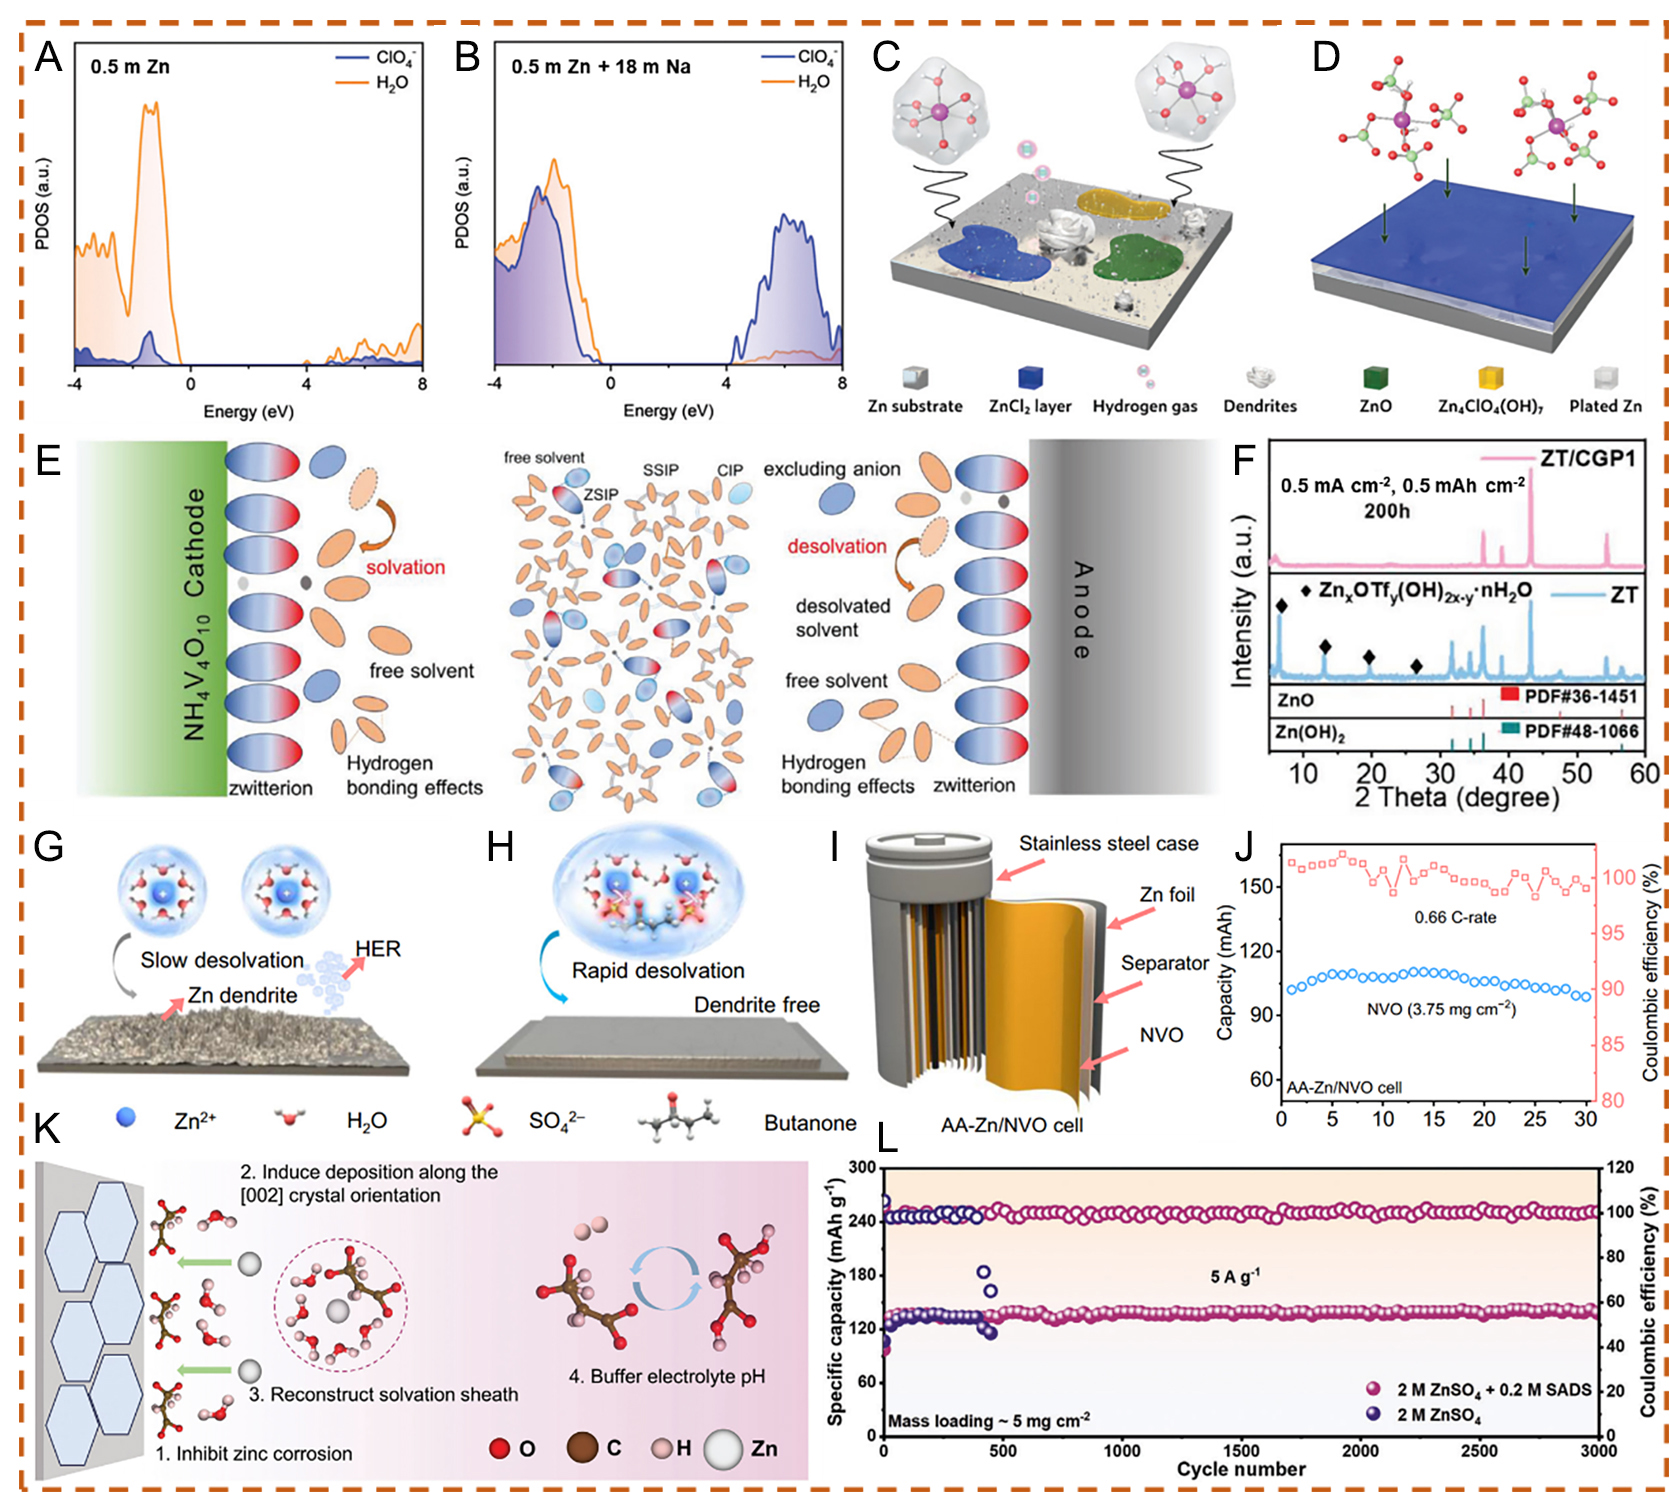
Figure 4. Projected density of states (PDOS) plots of 0.5 m Zn(ClO4)2 (A) and 0.5 m Zn(ClO4)2 + 18 m NaClO4 (B). Schematic illustration of Zn2+ solvation structures and the corresponding interfacial reactions in (C) 0.5 m (ZnClO4)2 and (D) 0.5 m Zn(ClO4)2 + 18 m NaClO4. (A-D) Reproduced with permission from[76]. Copyright 2021, The Royal Society of Chemistry. (E) Schematic illustration of solvent-related decomposition in conventional electrolytes for AZIBs. (F) X-ray diffraction (XRD) patterns after 100 cycles in ZT and ZT/CGP1 electrolytes. (E and F) Reproduced with permission from[77]. Copyright 2024, Wiley-VCH GmbH. Schematic diagrams of Zn anode behavior in (G) localized concentrated electrolyte (LCE) and (H) WSE. (I) Schematic illustration of AA-type Zn/NVO cells. (J) Cycling stability at 0.66 C for AA-type Zn/NVO cells. (G-J) Reproduced with permission from[78]. Copyright 2024, The Author(s). (K) Illustration of the protection mechanism of the SADS additive on the Zn anode. (L) Long-term cycling performance of Zn||I2 full cells at 5 A g-1.


