



fig3
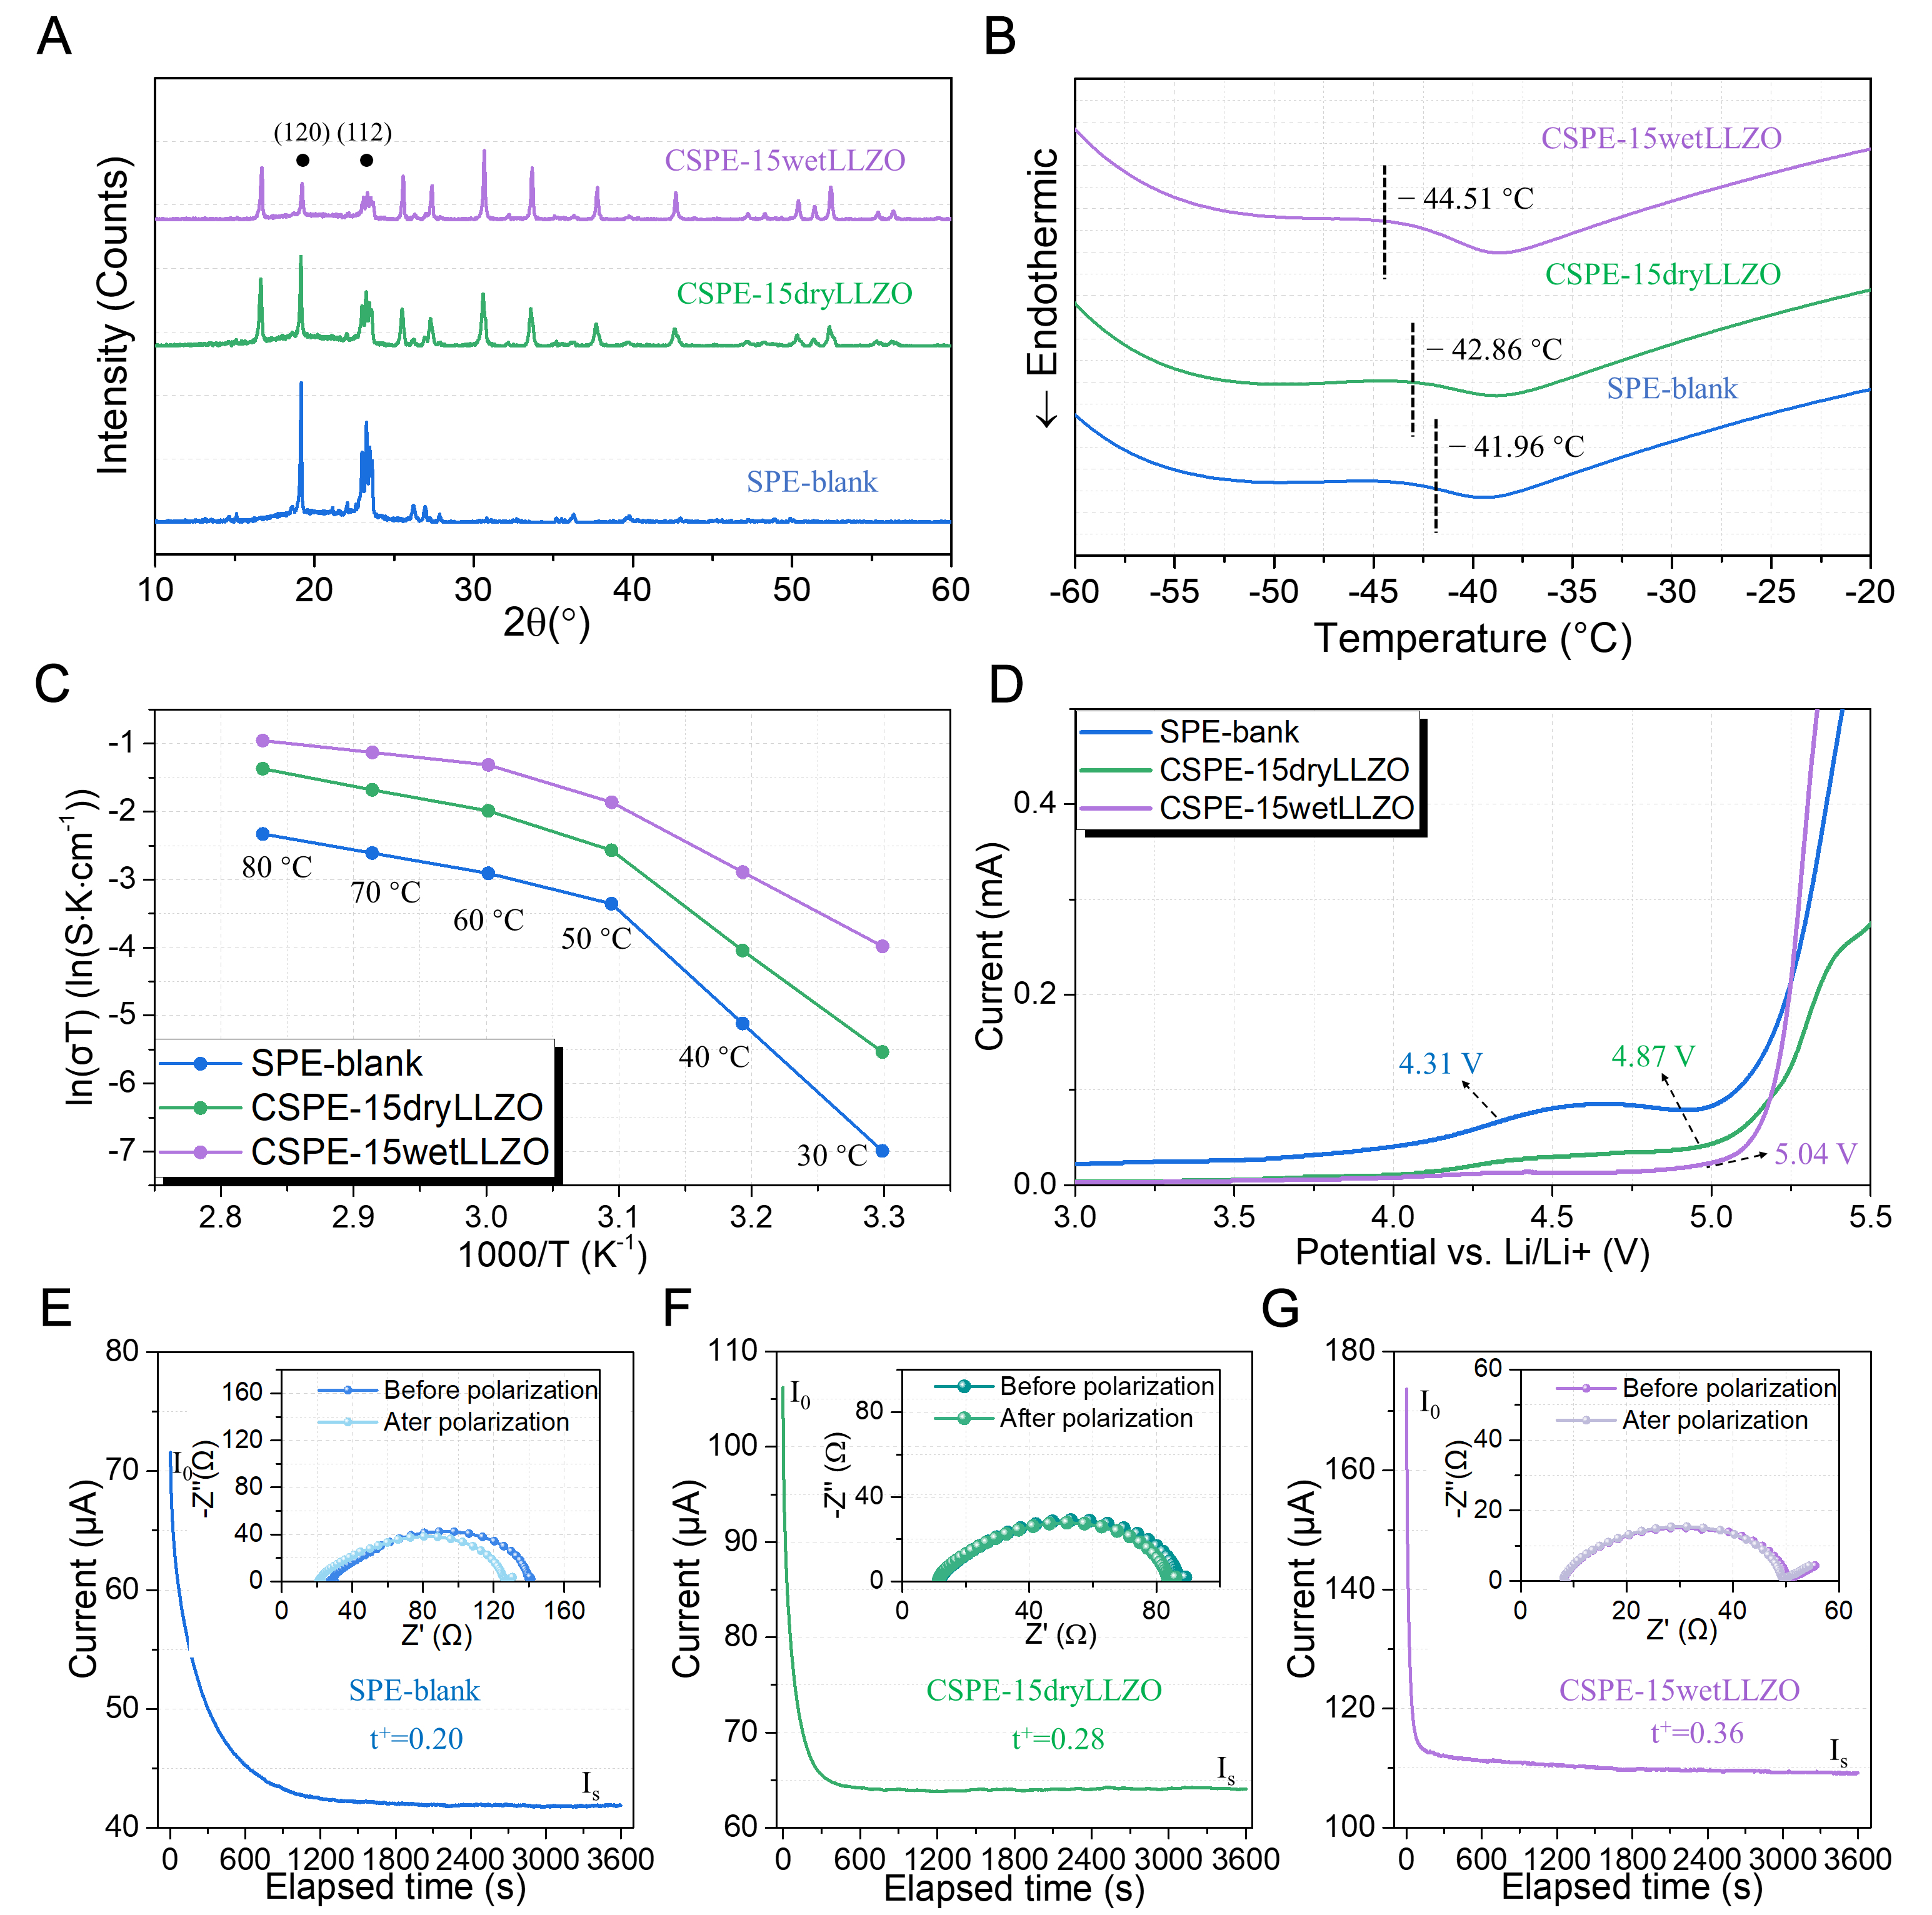
Figure 3. (A) XRD patterns of CSPE-15 wet-LLZO, CSPE-15 dry-LLZO, and SPE-blank, (B) DSC curves of CSPE-15 wet-LLZO, CSPE-15 dry-LLZO, and SPE-blank, (C) Lithium-ion conductivity curves at 30-80 °C; (D) LSV curves at 60 °C for SPE-blank, CSPE-15 dry-LLZO, and CSPE-15 wet-LLZO, (E-G) Chronoamperometry (CA) curves and EIS spectra before and after polarization at 60 °C and a potential of





