


fig5
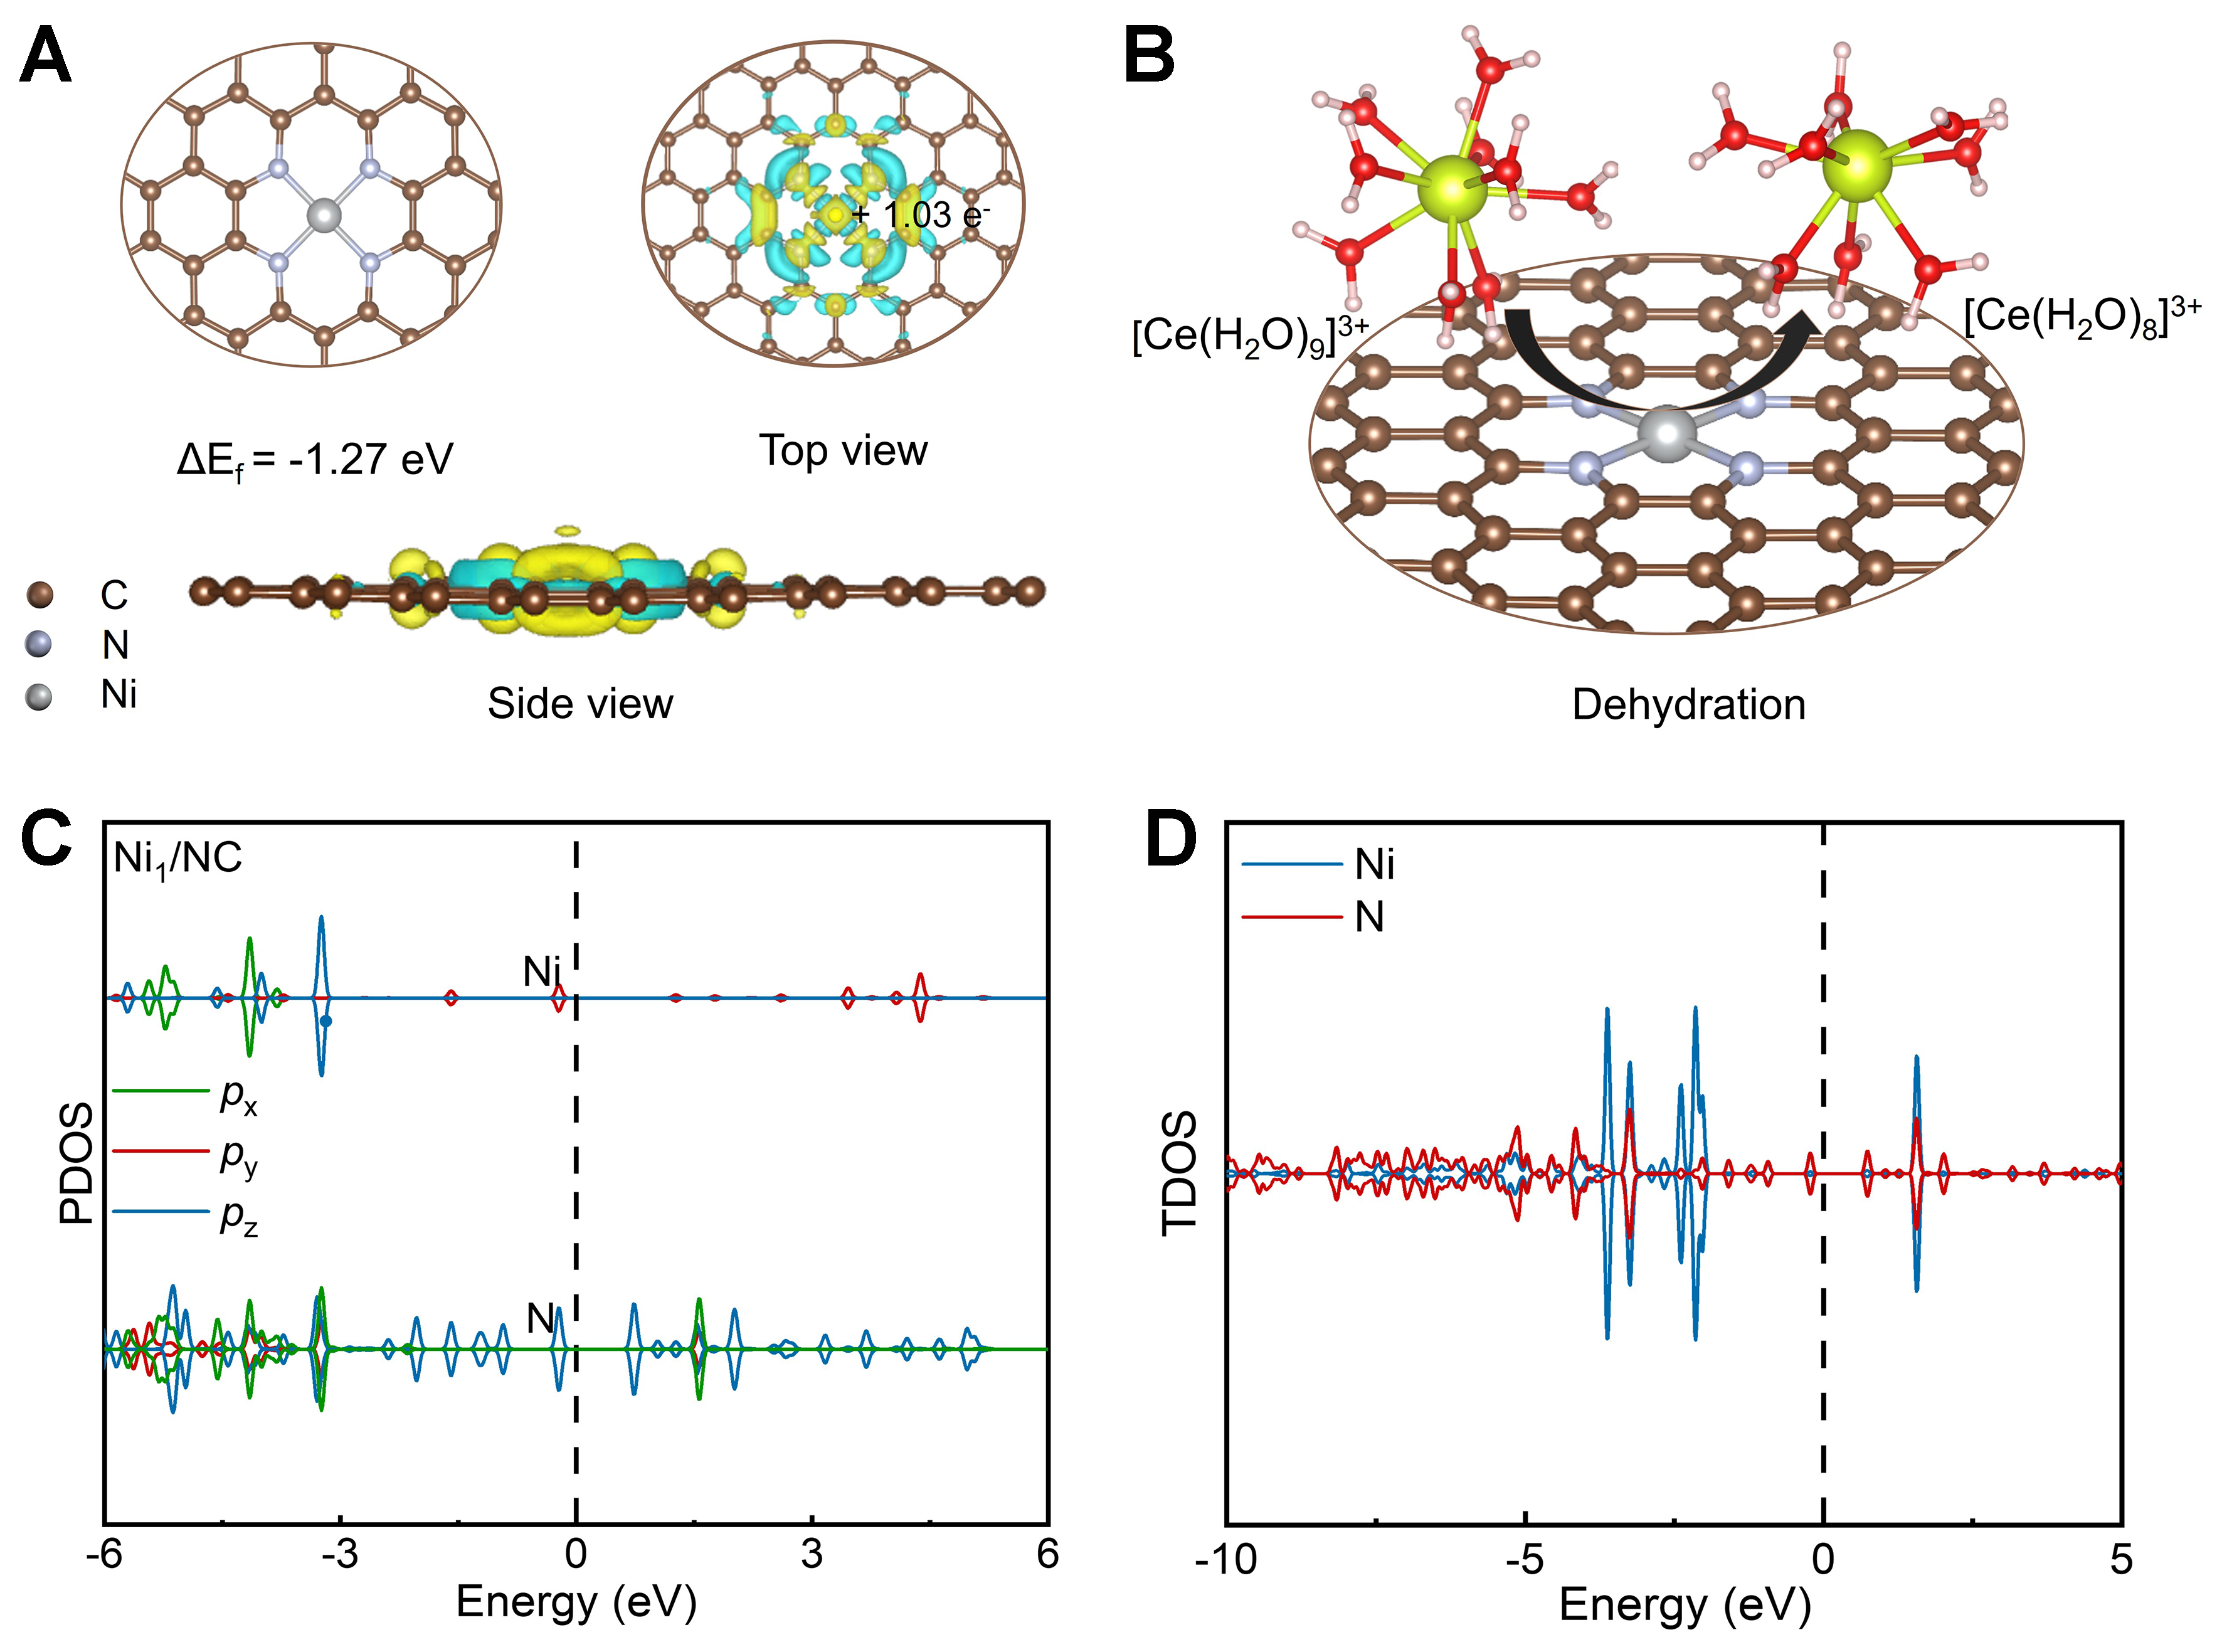
Figure 5. Theoretical calculations of Ni1/NC. (A) Optimized Ni–N4 configuration (the formation energy is -1.24 eV) and differential charge analysis of Ni1/NC. The yellow and cyan iso-surfaces represent areas of electron enrichment and deficiency, respectively; (B) Schematic of the dehydration process from [Ce(H2O)9]3+ to [Ce(H2O)8]3+; (C) PDOS and (D) TDOS of Ni1/NC. NC: Nitrogen-doped carbon; PDOS: projected density of states; TDOS: total density of states.


