


fig6
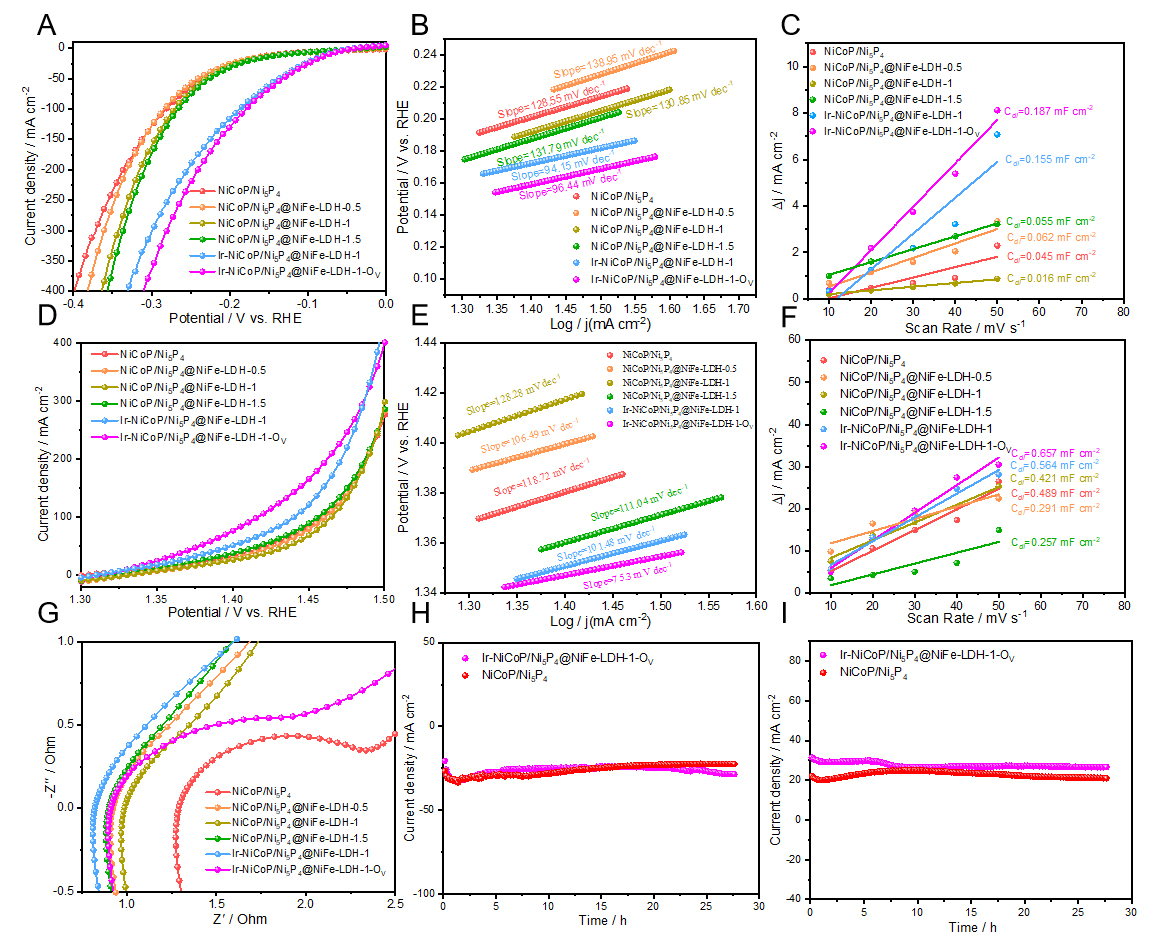
Figure 6. HER and AOR performance of the samples in 1 M KOH + NH3·H2O. (A) LSV curves, (B) Tafel plots, and (C) Cdl value of HER; (D) LSV curves, (E) Tafel plots, (F) Cdl value, and (G) EIS curves of AOR; (H) Chronoamperometric stability tests of HER; (I) Chronoamperometric stability tests of AOR. HER: Hydrogen evolution reaction; AOR: ammonia oxidation reaction; LSV: linear sweep voltammetry; EIS: electrochemical impedance spectroscopy.


