


fig5
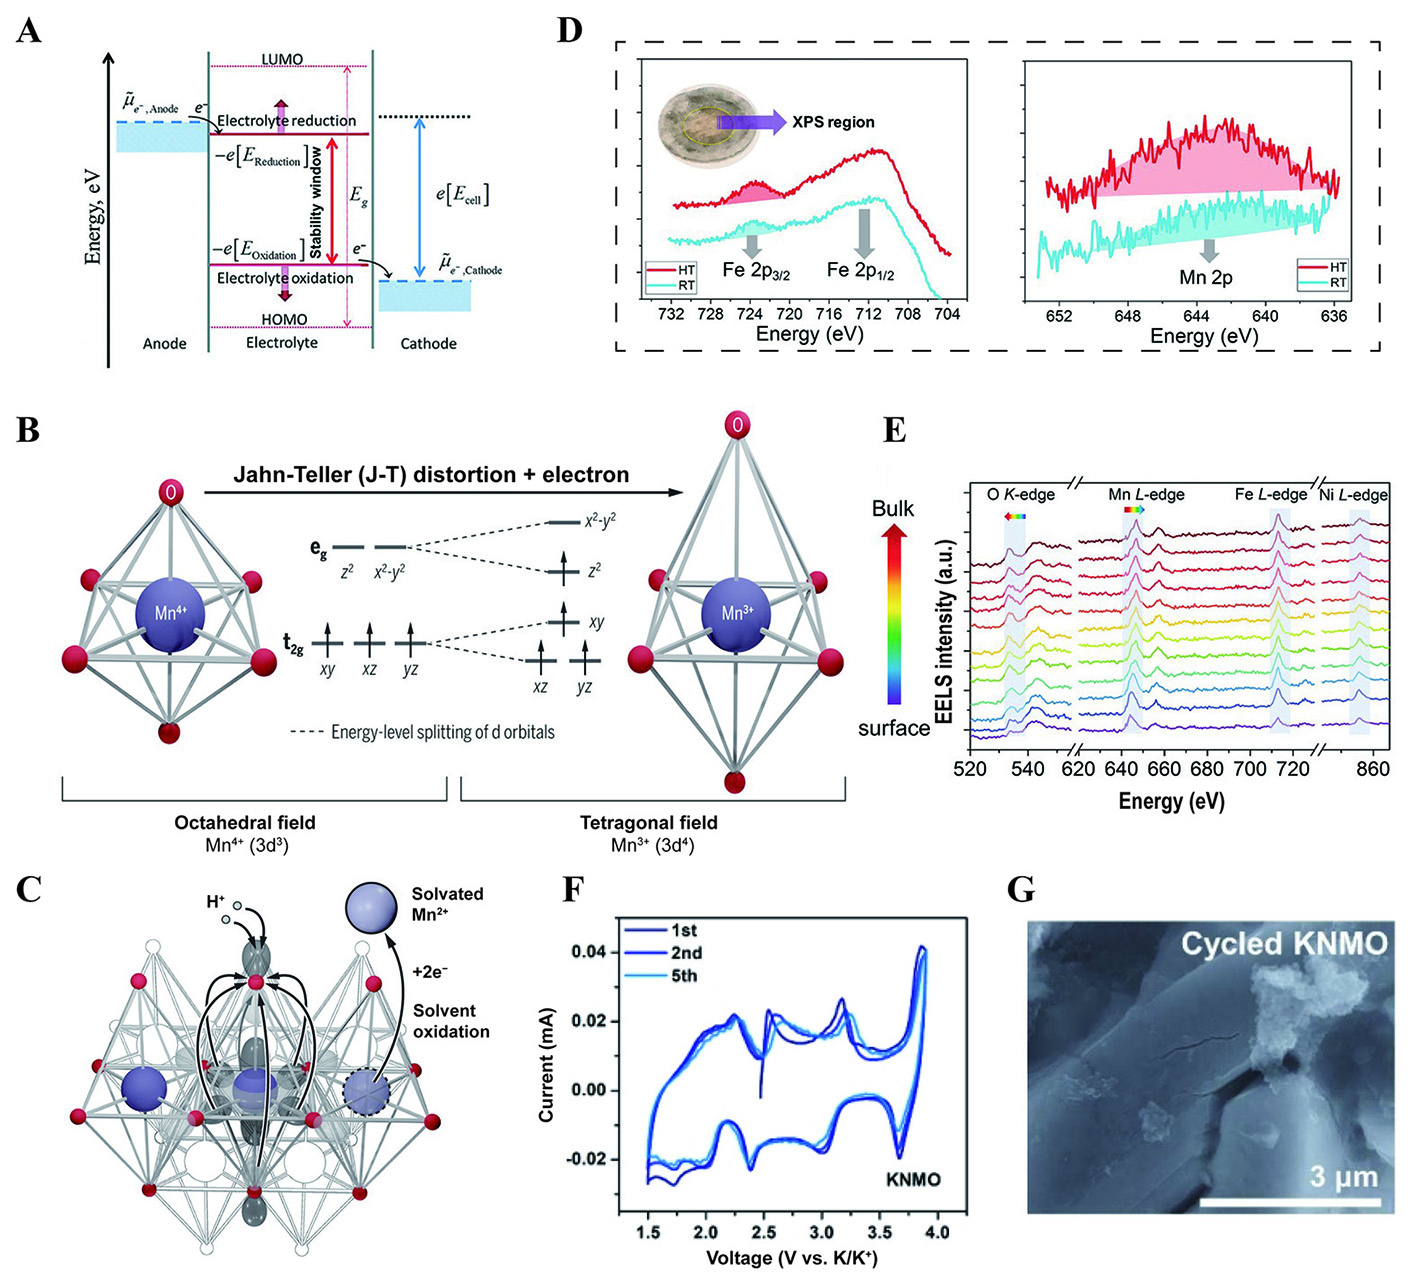
Figure 5. (A) Schematic illustrating the energy states of the electrodes and the electrolyte, leading to the formation of the SEI and cathode electrolyte interphase[63]. Reprinted with permission from Ref.[63]. Copyright 2020 Royal Society of Chemistry[63]. (B) The ligand field in manganese oxides and the schematic diagram of the J-T distortion of Mn3+[70]. (C) Diagram of transition metal ion dissolution[70]. (B and C) Figures reprinted with permission from Ref.[70]. Copyright 2020 The American Association for the Advancement of Science[70]. (D) The Fe 2p and Mn 2p spectra from the light-yellow region of the separator after being cycled in cells 20 times at 25 and 45 °C[71]. (E) EELS spectra of O K-edge, Mn, Co and Ni L-edges collected from the surface to the subsurface on a representative particle with an increment of 1 nm per spectrum[71]. (D and E) Figures reprinted with permission from Ref.[71]. Copyright 2018 Wiley-VCH[71]. (F) CV curves at the scan rate of 0.1 mV s-1 for KNMO in the initial five cycles[74]. (G) SEM image of the cycled electrodes[74]. (F and G) Figures reprinted with permission from Ref.[74]. Copyright 2023 Wiley-VCH[74].


